In this article, I will show you how to forecast free cash flow to the firm (FCFF), also known as unlevered free cash flow (UFCF). FCFF is the cash a company generates for all its capital providers, before considering interest payments. Typically, investors forecast FCFF to assess the attractiveness of an investment and to value the company through the discounted cash flow (DCF) model, which involves projecting these cash flows and discounting them to determine intrinsic value. Therefore, it's important to understand how to build a financial model to accurately forecast these unlevered future cash flows, as it can significantly affect your interpretation of the company's investment potential and its implied intrinsic value.
This article will explain how to calculate and normalize FCFF, discuss the importance of understanding the business, then provide step-by-step instructions with a real-world example on how to forecast FCFF.
How to Calculate Free Cash Flow to the Firm (FCFF)
Free cash flow to the firm (FCFF), also known as unlevered free cash flow (UFCF), represents the amount of cash generated by a company that is available to all capital providers, including debt holders, preferred stockholders, and common stockholders, after covering operating expenses, including depreciation and amortization (D&A), and investments in capital expenditures (CapEx) and non-cash net working capital (NWC).
The standard formula to calculate FCFF is shown below:
FCFF = EBIT × (1 - Tax Rate) + D&A - CapEx - Change in Non-Cash NWC
where:
- FCFF = free cash flow to the firm (aka unlevered free cash flow (UFCF))
- EBIT = earnings before interest and taxes
- Tax Rate = effective tax rate applied to company's taxable income (income tax expense / earnings before tax (EBT))
- D&A = depreciation and amortization
- CapEx = capital expenditures
- Change in Non-Cash NWC = change in non-cash net working capital
In short, to calculate FCFF, start with the company's operating income or EBIT (earnings before interest and taxes), an indicator of the company's profitability excluding interest and tax expenses. This figure is then adjusted for taxes to get NOPAT (net operating profit after taxes), adds back non-cash expenses like depreciation and amortization (D&A), and subtracts capital expenditures (CapEx) and changes in non-cash working capital (NWC).
This calculation provides a clear view of the cash generated by a company that is available for distribution to all capital providers, highlighting the firm's ability to generate cash from its operations.
The article linked below discusses the components of FCFF and its calculation process more in-depth:
How to Normalize FCFF
After you calculate FCFF, normalization is essential for accurate valuations and forecasting. Without normalization, the FCFF may include anomalies or one-time events, skewing comparisons between companies and potentially misrepresenting the firm's future financial performance. Since forecasts rely heavily on the last fiscal year's FCFF, it's important to ensure this figure reflects the company's sustainable operations.
Normalizing FCFF involves adjusting this calculation to exclude non-core and one-time operations, ensuring the figure more accurately reflects the company’s ongoing operations. To normalize FCFF, calculate an average effective tax rate over several years instead of using a single year's rate, average out CapEx if it fluctuates significantly, and adjust for any non-recurring non-cash items or significant one-time events that do not reflect ongoing operations.
The article linked below discusses the FCFF normalization process more in-depth:
Importance of Understanding the Business
Before building a model to forecast the company's future unlevered free cash flows (UFCF), it's important to truly understand how the company operates, what's happening in its industry, and who its competitors are. This will help you determine the factors influencing the company's earnings, costs, and investments, as well as identify risks or opportunities for growth that could affect its future performance.
Further, understanding where the company stands within its business life cycle, whether it's a startup, in a growth phase, mature, or in decline is important for forecasting. The image below provides an overview of the business life cycle and its various stages:

In short, a company in the growth phase might sustain high revenue growth rates, whereas a mature company could see more stable, moderate growth. This life cycle stage influences investment needs, risk profiles, and cash flow characteristics, making it an essential consideration for accurate forecasting.
Analyzing long-term trends and recent shifts is also important. For example, if revenue has grown at a compound annual growth rate (CAGR) of 5% over the past five years, expecting a sudden increase to 10% without justification is unrealistic. Similarly, an increase in spending could indicate the need to account for higher expenses in future projections. Understanding these revenue and cost trends is key for more reasonable future UFCF estimations.
8 Steps to Forecast Free Cash Flow to the Firm (FCFF)
Now that you know how to calculate free cash flow to the firm (FCFF), how to normalize the figure, and the importance of understanding the business before forecasting, the rest of this article will provide detailed steps explaining how to forecast FCFF.
For our example, we'll demonstrate how to forecast FCFF for Crocs (CROX), a popular casual footwear company.
Step #1: Gather Historical Financial Statements
Begin by collecting the company's income statement and balance sheet for the past 3-5 years. This historical data will provide the basis for your projections.
Financial data can be found on the most recent 10-K annual report from the SEC's website or the investor relations section of its website. Utilizing financial data websites like QuickFS, which standardize financial statement data (as I've done for our Crocs example), can also simplify this step and forecasting, though it may oversimplify certain line items.
You can download the file below, which presents Crocs' standardized income statement, balance sheet, and cash flow statement in a formatted manner, alongside the FCFF forecast model presented in this article:
Note that because the income statement and balance sheet capture depreciation, capital expenditures, and non-cash adjustments, and because the cash flow statement can be constructed from the income statement and balance sheet, directly using the cash flow statement is neither required nor conventional for forecasting FCFF.
Step #2: Determine Your Forecast Horizon
The next step involves deciding the length of the forecast for the FCFF calculation.
Choosing an appropriate forecast horizon is important because it directly influences the accuracy of the valuation. An overly optimistic forecast period for a mature company might overestimate its growth potential, while an overly conservative period for a growth company might undervalue its future cash flows. Therefore, aligning the forecast period with the company's life cycle stage, market conditions, and industry growth expectations is essential for creating a realistic FCFF model.
Commonly, projections extend over a period of 5 to 10 years, largely due to their rounded numerical nature. Typically, a shorter forecast period is selected for mature companies with relatively predictable cash flows. Conversely, for growth companies requiring time to stabilize at a terminal growth rate, a longer forecast period is often more appropriate.
For our example, since Crocs is a moderately established company, we'll use a 5-year forecast horizon.
Step #3: Calculate Historical NOPAT
Conventionally, NOPAT is calculated using the formula below:
NOPAT = EBIT × (1 - Tax Rate)
where:
- NOPAT = net operating profit after tax (aka EBIAT (earnings before interest after taxes))
- EBIT = earnings before interest and taxes
- Tax Rate = effective tax rate applied to company's taxable income (income tax expense / earnings before tax (EBT))
Applying taxes to EBIT shows the operational income after taxes, known as NOPAT or EBIAT, as if there were no interest expenses. This approach calculates the operating profit after taxes, pretending the company has no debt. It helps us understand the income left after taxes, highlighting how the company generates cash from its main operations, without considering financing.
However, when building a FCFF forecast model, the NOPAT calculation approach is slightly different...
Begin by sourcing the company's total revenue, cost of goods sold (COGS), and gross profit from its income statement. Then, to normalize the figure, subtract all of the company's recurring operating expenses from gross profit to get operating income (EBIT).
Directly starting with EBIT isn't recommended for a detailed FCFF model because forecasting requires analyzing revenues, COGS, and operating expenses based on past performance.
Now, to calculate NOPAT, instead of adjusting EBIT by "(1 - Tax Rate)" to account for taxes, use the actual income tax paid from the income statement. This method captures the real tax impact on the company's earnings as they are, based on its operational results and financial decisions.
Thus, by subtracting the actual income tax from EBIT, we derive NOPAT. This calculation is more aligned with the FCFF model's focus on the cash actually available from operations, bypassing theoretical tax adjustments. This approach therefore provides a direct and practical measure of the company’s capability to generate cash after its tax obligations.
The first part of the FCFF model for Crocs is shown in the image below:
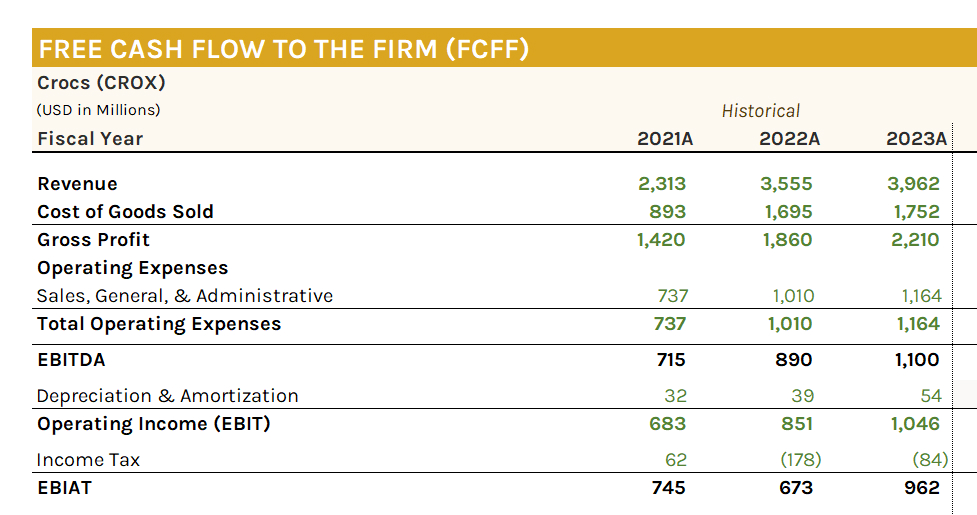
Note that I've also included EBITDA (earnings before interest, taxes, depreciation, and amortization) in the model to make it more complete. EBITDA can either be directly pulled from the income statement or calculated by adding depreciation and amortization (D&A) to EBIT. D&A figures can be obtained from either the company's income statement or its cash flow statement, as these numbers are consistent across both documents.
Step #4: Forecast Revenues
The next step is to project the revenue of the company for each year of the forecast period. Depending on the availability and reliability of data, various methods can be used, such as utilizing historical growth rates or industry averages, market share and market size estimates, customer segments and unit economics, or bottom-up or top-down approaches. It's important to select the method that best suits the nature and characteristics of the business and to justify your assumptions and sources.
Furthermore, for a more accurate forecast, it's recommended to forecast the company's various products and/or services individually, rather than assuming all the company's products and/or services will grow at the same rate annually. Breaking up the revenue by geographical regions and/or by customer profiles (i.e., B2C, B2B, etc.) is also recommended. While these steps will make the model more sophisticated, they are good practices to follow since you're predicting the future.
Lastly, creating conservative, base, and optimistic cases for the revenue growth scenarios is advisable for every FCFF model. This approach allows you to evaluate how the forecasted FCFF will change based on your assumed worst, middle, and best-case scenarios for the company's future revenues. This strategy also aligns well with the discounted cash flow (DCF) valuation model, where such scenario analyses are recommended.
Because Crocs is a relatively straightforward business, we'll just create conservative, base, and optimistic case assumptions to forecast projected revenues.
Crocs has experienced a 10-year CAGR growth in their revenues (from 2014 to 2023) of ~12.7%, with higher figures over the 5-year and 3-year CAGR periods as well. Based on this past performance alone (and to be conservative), we'll assume that revenues will grow at 5.0%, 10.0%, and 15.0% annually over the next 5 years of the forecast period, for our conservative, base, and optimistic cases, respectively.
The image below demonstrates how revenues are forecasted in a FCFF model, across these three scenarios for Crocs:

Here, future revenues are simply grown year-over-year, based on the company's last fiscal year's revenues ($3,962M in FY 2023, for Crocs). For instance, the base case revenues in FY 2024 are $4,160M, calculated as "$3,962M × (1 + 0.10)."
Further, the first line in the revenue projection is typically based on the company's last fiscal year's revenue growth, or an average over the last 3-5 years. In our case this is just 11.4%. It can be used in a FCFF model to show what the company's FCFF would be if revenues continued to grow at the same rate over the 5-year FCFF forecast horizon.
Step #5: Forecast COGS, Operating Expenses, and Income Taxes
After projecting the revenue, the next step is to estimate the company's COGS, operating expenses, and income taxes for each year of the forecast period.
These expenses include cost of goods sold (COGS) and significant recurring operating expenses such as research and development (R&D) and sales, general, and administrative (SG&A), but not depreciation & amortization (D&A) -- this comes later. In Crocs' case, there are COGS and one main operating expense, which is SG&A.
For COGS and operating expenses, the common approach is to use the "percentage of revenue/sales" method. This involves dividing the amount of COGS and each operating expense by the company's total revenue to determine what portion of total revenues these costs represent. This method is based on the premise that a company's costs are often proportional to its revenue, making it a practical approach for forecasting expenses as the business grows.
For income taxes, a similar approach is followed, but instead of using revenue as the basis, taxes are calculated as a percentage of operating income (EBIT). This method more accurately reflects the company's tax obligations based on its operational profitability, rather than its total revenue.
These calculations should be in the assumptions section of the FCFF model, as shown below for Crocs:
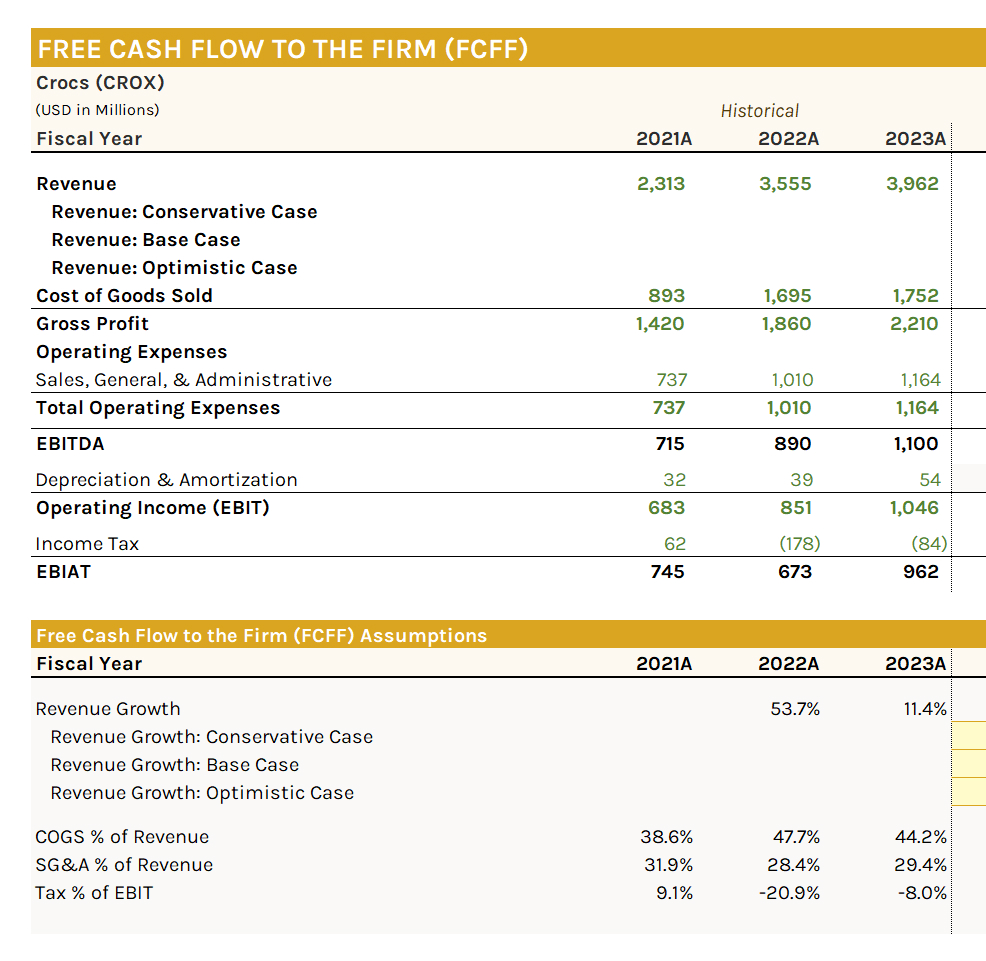
To forecast these expenses, start by assuming the percentages of COGS and operating expenses to sales/revenue, and income taxes to EBIT, remain consistent with the last fiscal year's figures. Alternatively, you can use an average of these percentages over the past 3-5 years for the entire forecast period. Choose the method that aligns best with your analysis and seems most accurate and reasonable. For our example, we'll just assume Crocs' forecasted expenses stay in line with the figures from the last fiscal year.
Then, to calculate forecast COGS and operating expenses, multiply the percentage of sales/revenue assumptions by the company's forecasted revenue. Then, calculate gross profit by subtracting forecasted COGS from forecasted revenues:
Gross Profit = Revenues - Cost of Goods Sold (COGS)
Next, calculate future income tax by applying the assumed tax percentage of EBIT to the projected EBIT, which is calculated using the formula below:
Operating Income (EBIT) = Gross Profit - Total Operating Expenses
Clearly, forecasting income taxes requires completing the earlier steps because the forecasted EBIT depends on subtracting forecasted total operating expenses from forecasted gross profit.
Here's the standard FCFF model (up to NOPAT) for Crocs, with these steps completed, ignoring our conservative, base, and optimistic case scenarios:

Note that the forecasted EBITDA calculation here is incomplete and the forecasted D&A is blank, as we have yet to forecast D&A in our FCFF model. However, the forecast NOPAT (aka EBIAT) can be calculated by applying the same process discussed in step #3 above.
Here's the completed FCFF model (up to NOPAT) for Crocs, with the conservative, base, and optimistic case scenarios modeled:
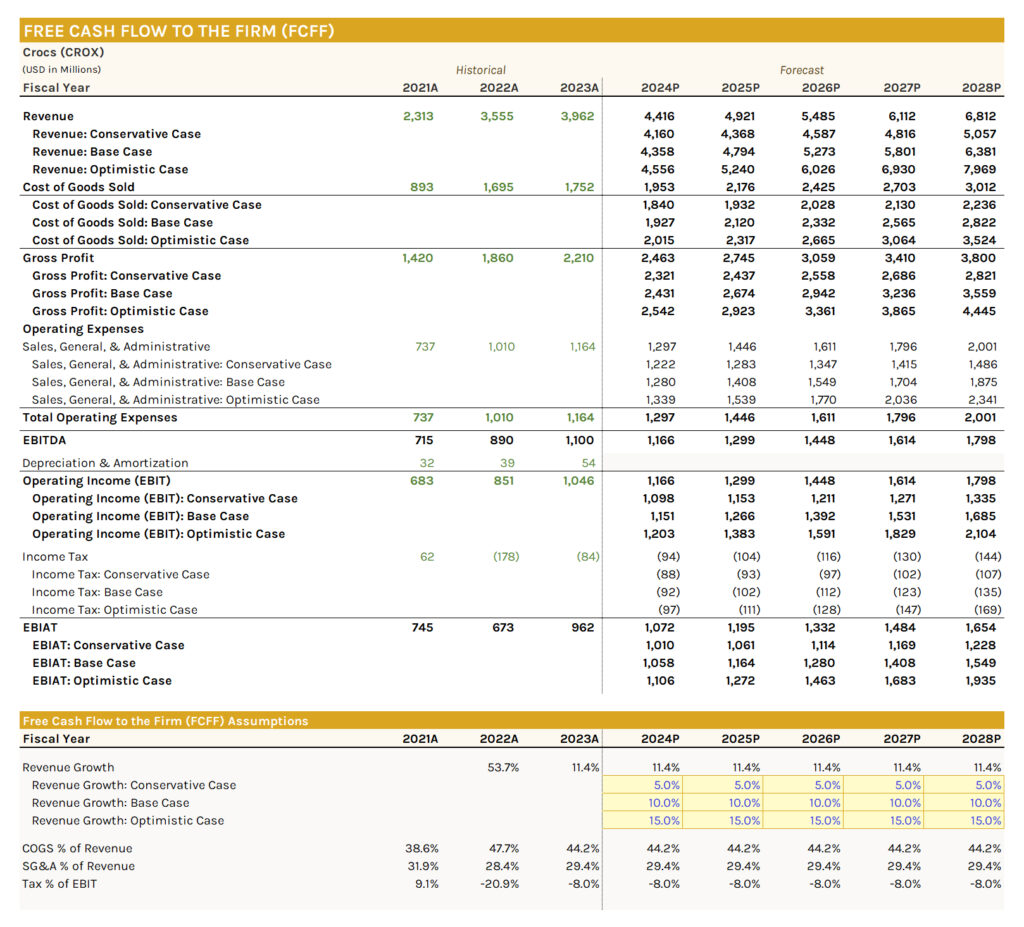
Here, the process and calculations remain consistent, with the only difference being that the income statement cost and profitability figures are based on the conservative, base, and optimistic case revenue assumptions (of 5.0%, 10%, and 15.0% respectively), instead of the revenue forecast growing at 11.4% annually.
Overall, this method of forecasting COGS, operating expenses, and income taxes is straightforward, though it may oversimplify reality. Therefore, it's important to consider industry benchmarks and potential shifts in the company's cost structure or efficiency that could affect future margins.
Step #6: Fixed Assets Schedule to Forecast CapEx and D&A
The next step involves creating a supplementary schedule, specifically a fixed assets schedule, to forecast capital expenditures (CapEx) and depreciation and amortization (D&A). The percentage of revenue/sales method is sometimes used to forecast these items, but it's not the best approach because it does not accurately reflect the actual investment and usage patterns of fixed assets.
Capital expenditures (CapEx) are the amounts a company spends to acquire or upgrade physical assets such as property, buildings, or equipment (PP&E). Depreciation and amortization (D&A) allocate the cost of tangible and intangible assets over their useful lives, reflecting their usage and loss of value.
This schedule starts with the beginning property, plant, and equipment (PP&E), which is the net value from the end of the previous year from the balance sheet, setting the foundation for the forecast. D&A figures are then sourced from the income statement or cash flow statement. The ending PP&E is just the net value for the current year.
The historical CapEx figure is then calculated using the formula shown below:
CapEx = Ending PP&E - Beginning PP&E + D&A
This formula calculates the company's total investment in physical assets over the period. By subtracting the beginning PP&E from the ending PP&E, it gauges the net change in the asset base, reflecting both acquisitions and disposals. Adding D&A back into the equation accounts for asset consumption due to use or wear, ensuring the calculation encompasses all capital expenditures. The cash spend on CapEx, commonly labeled as PP&E or "Purchases of PP&E" (or something similar) under the Investing Activities section of a cash flow statement, is what this formula is effectively calculating.
Now that the historical fixed assets schedule is completed, an assumptions section can be built to forecast D&A and CapEx, specifically as a percentage of beginning PP&E. These percentages are based on beginning PP&E to reflect the proportional relationship between the company's initial asset base and its expected investment and depreciation activities.
The image below demonstrates the historical fixed assets schedule and assumptions section for Crocs:
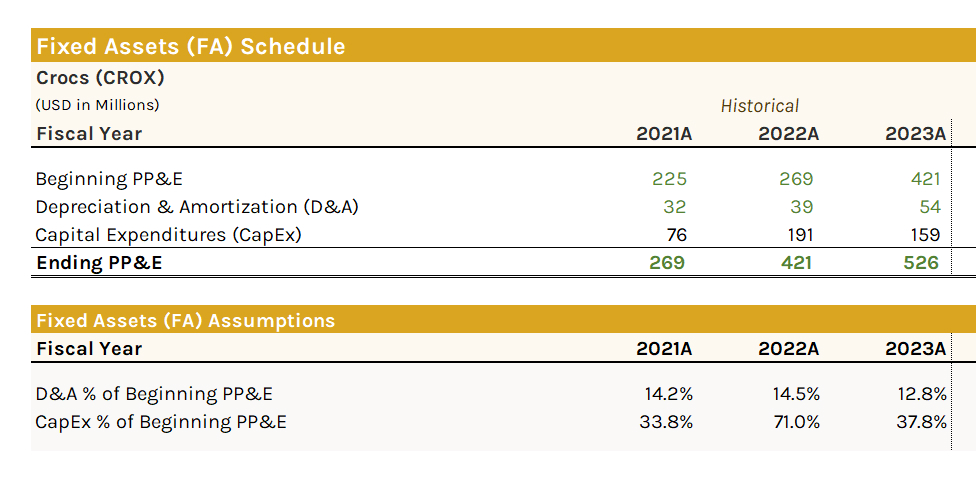
Future D&A and CapEx projections can then be based on these historical percentages, either from the last period or as an average over the past 3-5 years. For our example, we'll assume Crocs' forecasted D&A and CapEx stay in line with the figures from the last fiscal year.
Forecasted D&A is then estimated as a percentage of beginning PP&E to reflect expected asset depreciation. Similarly, CapEx is estimated as a percentage of beginning PP&E, indicating planned investments in physical assets. Since D&A recognizes the cost of past CapEx over time, ensure that it remains below CapEx in growth scenarios; otherwise, the forecast may be inaccurate.
Further, with the forecast fixed assets schedule, the beginning PP&E is simply the ending PP&E from the previous year. The ending PP&E is then calculated as follows:
Ending PP&E = Beginning PP&E - D&A + CapEx
By subtracting D&A from the beginning PP&E, we account for the wear and loss of value in existing assets. Adding CapEx then reflects the company's investments in new or upgraded assets. This approach ensures that the company's investments in fixed assets are accurately accounted for, maintaining a balance between growth and asset maintenance.
The image below demonstrates the completed fixed assets schedule for Crocs:

In summary, constructing a detailed fixed assets schedule provides a structured and realistic approach to forecasting CapEx and D&A, essential components for understanding a company's future financial health and operational capacity.
Step #7: Non-Cash Net Working Capital (NWC) Schedule
To calculate the final component of the FCFF calculation, a non-cash NWC schedule can be built. Again, the percentage or revenue/sales method is sometimes used to forecast non-cash NWC, but this approach is not recommended because it does not consider the operational cycles of receivables, inventory, and payables, which can significantly impact the company's liquidity and operational efficiency.
For reference, here's the formula to calculate the firm's non-cash net working capital (NWC):
Non-Cash NWC = Non-Cash Current Assets - Non-Cash Current Liabilities
where:
- Non-Cash Current Assets: These are the current assets of a company excluding cash and cash equivalents. They typically include accounts receivable, inventory, and other short-term assets that are not in the form of cash.
- Non-Cash Current Liabilities: This refers to the current liabilities of a company excluding any current portion of long-term debt. These liabilities usually include accounts payable, accrued expenses, and other short-term obligations not related to debt.
To build a non-cash NWC schedule, begin by pulling the company's non-cash current assets and non-cash current liabilities into the schedule. The reason we only consider non-cash NWC items for the FCFF calculation is because these elements directly impact the operational liquidity and working capital requirements, excluding cash operations and financing activities.
Non-cash current assets exclude items such as cash & equivalents and marketable securities, while non-cash current liabilities exclude items such as short-term debt and the current portion of long-term debt.
For our Crocs example, our non-cash NWC schedule excludes "Cash & Equivalents" from the non-cash current assets, and excludes "Short-Term Debt" from the non-cash current liabilities.
Next, we'd build an assumptions section to forecast these non-cash NWC items. Here, you'd just use the percent of revenue/sales method for the non-cash current asset and non-cash current liabilities items, as we did previously for the operating expenses section of the forecast FCFF calculation.
However, there are certain operational assumptions that influence the collection of receivables, the management of inventory, and the payment of obligations. Therefore, you would follow a different method to forecast accounts receivable, inventories, and accounts payable, which are typically the main components of a non-cash NWC schedule.
First, for accounts receivable, you'd calculate the days sales outstanding (DSO), which reflects the average number of days it takes to collect payment after a sale. Its formula is shown below:
DSO = (Accounts Receivable / Revenue) × 365
Next, for inventories, you'd calculate the days inventory outstanding (DIO), which measures the average number of days a company holds inventory before selling it. Its formula is shown below:
DIO = (Inventories / Cost of Goods Sold) × 365
Finally, for accounts payable, you'd calculate the days payable outstanding (DPO), which is the average number of days a company takes to pay its bills and invoices. Its formula is shown below:
DPO = (Accounts Payable / Cost of Goods Sold) × 365
For all of these calculations, you can follow a 360-day or 365-day convention. A 360-day year is often used in financial modeling for simplicity and ease of calculations, aligning with many businesses' and banks' practices. In contrast, a 365-day year provides a more precise reflection of actual calendar days, which may be preferred for more accurate modeling of the company's operational cycle.
Here's the historical non-cash NWC schedule for Crocs and its assumptions section, with these steps completed:

To forecast these non-cash NWC items, similar to the previous steps, you'd start by assuming the percentages and number of days remain consistent with the last fiscal year's figures. Alternatively, you can use an average of these percentages and number of days over the past 3-5 years for the entire forecast period. Again, select the method that aligns best with your analysis and seems most accurate and reasonable. For our example, we'll just assume Crocs' forecasted non-cash NWC items stay in line with the figures from the last fiscal year.
Now, once forecasted, the non-cash current assets and non-cash current liabilities that are not accounts receivable, inventories, or accounts payable would just be forecasted as a percentage of revenue, providing a straightforward method to estimate their future values based on the expected sales performance of the company. Thus, by linking these items to revenue, the model assumes that they will grow proportionally with the company's operations.
For accounts receivable, inventories, and accounts payable, because our assumptions are based on a number of days convention, we need to convert these back into dollar format by effectively reversing the formulas applied earlier.
To begin, DSO can be used to calculate the firm's projected accounts receivable, as follows:
Accounts Receivable = (DSO × (Revenue / 365))
Next, DIO can be used to calculate the firm's projected inventories, as follows:
Inventories = DIO × (Cost of Goods Sold / 365)
Lastly, DPO can be used to calculate the firm's projected accounts payable, as follows:
Accounts Payable = DPO × (Cost of Goods Sold / 365)
Here's the standard non-cash NWC schedule for Crocs with these steps completed, ignoring our conservative, base, and optimistic case scenarios:

Here's the completed non-cash NWC model for Crocs, with the conservative, base, and optimistic case scenarios modeled:
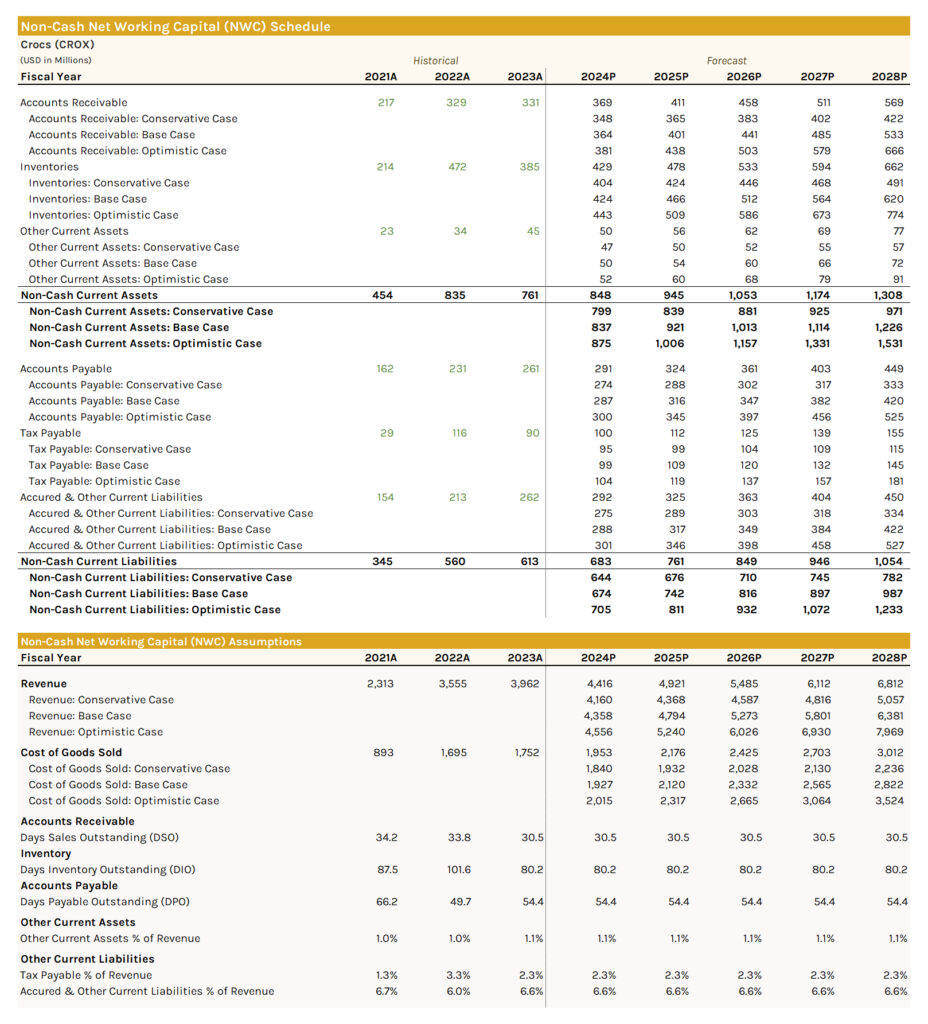
This comprehensive approach to modeling non-cash NWC enables a nuanced understanding of Crocs' operational liquidity and efficiency, essential for an accurate FCFF calculation.
Step #8: Calculate FCFF
Now that we have all the components and relevant schedules built, we can calculate FCFF using the formula shown below (described earlier):
FCFF = NOPAT + D&A - CapEx - Changes in Non-Cash NWC
In the FCFF model, include the final line items for depreciation and amortization (D&A), capital expenditures (CapEx), and changes in non-cash net working capital (NWC).
The historical and forecasted D&A and CapEx figures should be referenced from the completed fixed assets schedule.
The historical and forecasted non-cash current assets and non-cash current liabilities should be referenced from the non-cash NWC schedule. As previously discussed, non-cash NWC is calculated by subtracting non-cash current liabilities from non-cash current assets. The change in non-cash NWC is simply the year-over-year difference in non-cash NWC, indicating how much working capital is absorbed or released by the company's operations.
The FCFF model calculation can be summarized as follows:
- Start with earnings before interest and taxes (EBIT), because it represents the company's operating profit excluding the effects of financing and taxes.
- Adjust EBIT for taxes to get net operating profit after taxes (NOPAT), because this reflects the company's operational profitability after accounting for tax obligations.
- Add back non-cash expenses (D&A), because they are non-cash expenses that don't affect cash flows.
- Subtract cash outflows for investments (CapEx), because this is cash spent on acquiring or maintaining fixed assets.
- Adjust for changes in non-cash working capital (subtract increase or add decrease in non-cash NWC), because these adjustments reflect the cash impact of changes in operating working capital, indicating liquidity used or generated in operations.
The FCFF model in the image below shows how FCFF is calculated for Crocs (starting from EBIAT (aka NOPAT)):

Modeling all conservative, base, and optimistic scenarios provides a comprehensive view of the possible FCFF outcomes, as shown in the FCFF model below for Crocs:

This completes the FCFF model calculation. It's important to review your projections to ensure they match past trends and assumptions. Adjust as needed for a more accurate forecast, based on what you know about the business.
The Bottom Line
Calculating free cash flow to the firm (FCFF) is essential for assessing a company's financial health and investment potential. It involves starting with earnings before interest and taxes (EBIT) and adjusting for taxes to find the net operating profit after taxes (NOPAT). Then, non-cash expenses like depreciation and amortization (D&A) are added back, while cash outflows for capital expenditures (CapEx) and changes in non-cash net working capital (NWC) are subtracted. This calculation provides a comprehensive view of the cash available for distribution to all capital providers, such as debt holders and equity investors, highlighting the company's capacity to generate cash from its core operations.
For accurate FCFF forecasting, it's important that investors understand the company's operations, industry context, and competitive positioning. This includes analyzing historical financial statements, considering the company's stage in the business life cycle, and making informed assumptions about future revenues, expenses, and investments. By constructing schedules for fixed assets and non-cash NWC, and applying thoughtful projections based on historical data and operational insights, investors can gauge the company's future cash-generating ability. Ultimately, ensuring the FCFF calculation aligns with realistic, well-founded assumptions is key to deriving meaningful insights for valuation and investment decisions.
