In this article, I will demonstrate how to apply mid-year convention, also known as mid-year discounting, in discounted cash flow (DCF) valuation models. Typically, DCF models assume cash flows are received or paid at the end of each period. However, in reality, most businesses generate cash throughout the year. This can lead to standard methods over-discounting future cash flows. As a solution, the mid-year convention offers a more realistic approach, assuming that cash flows occur at the midpoint of each year.
This article will begin by providing background on DCF valuation models and their standard discounting method. Next, we'll explain the mid-year convention, including how to implement it in a spreadsheet model and its impact on valuations, including the terminal value. Finally, we'll discuss integrating the mid-year convention with stub periods in DCF models, offering a more detailed and precise valuation approach.
Discounted Cash Flow: The Standard Approach
Discounted cash flow (DCF) models value a company by projecting its future cash flows over a specific period (e.g., 5 or 10 years) and discounting them to their present value. This approach acknowledges the time value of money, suggesting that a dollar today is worth more than a dollar in the future because of its potential to earn returns. Hence, a company's worth is determined by the present value of all future cash flows it is expected to produce. Since cash flows projected further into the future carry greater uncertainty, they are discounted more heavily, reflecting a lower present value.
The premise of the DCF model is to calculate an asset's value as the total of these discounted future cash flows. In a standard DCF model, one begins by determining the forecast period, estimating free cash flows, the discount rate, and the terminal value. The company's intrinsic value is then calculated using the following DCF intrinsic value formula:
PV0 = [FCF1 / (1 + re)1] + [FCF2 / (1 + re)2] + … + [FCFn / (1 + re)n] + [TV / (1 + re)n]
where:
- PV0 = present value (at year 0)
- FCF1, FCF2, …, FCFn = projected free cash flows in periods 1, 2, through to n, respectively
- re = discount rate (aka required rate of return)
- n = number of periods into the future when cash flow occurs
- TV = terminal value (present value of all subsequent cash flows beyond the last projected period n)
In this model, we assume that the business we're valuing earns its cash at the end of each time period. This assumption is evident in the formula, where each period's cash flows are discounted by the full time period, as indicated by this portion of the formula:
PV0 = FCFn / (1 + re)n
Standard DCF Example
In a standard DCF model, you'd estimate a company's free cash flow (FCF) over the forecast period and then calculate its terminal value at the end of this period. FCF typically represents unlevered free cash flow (UFCF), defined as cash generated from operations less capital expenditures and without the effect of interest payments. The terminal value captures the company's worth beyond the forecast horizon. Both are discounted to their present values. Investors then adjust this present value for net cash (cash minus debt) and compare it to the company's market cap. If this adjusted value is higher than the current market price, the stock is undervalued; if lower, it's overvalued.
For simplicity, this article assumes "free cash flows (FCFs)" refers to simple FCF (cash from operations minus capital expenditures), without the need to adjust the present value for net cash. We'll compare the net present value of these FCFs, including the terminal value, with the market cap to determine valuation.
The DCF inputs/assumptions for the case study in this article are provided below:
- Last Fiscal Year: 12/31/2022
- Next Fiscal Year: 12/31/2023
- Valuation Date: 09/30/2023
- Number of Periods: 5 years
- FCF0: $100,000
- FCF Growth: 5.0%
- Discount Rate: 10.0%
- Terminal Value Method: Gordon Growth Model (GGM); with 2% terminal growth rate.
- Equity Value (Market Cap): $1,000,000
You can download a free copy of the workbook used in this article using the link below, which you can utilize for your own DCF models:
Note: This version is locked, restricting editing/viewing of locked cells except for the input cells. For the full version, please contact me.
To begin, here's the completed DCF model:
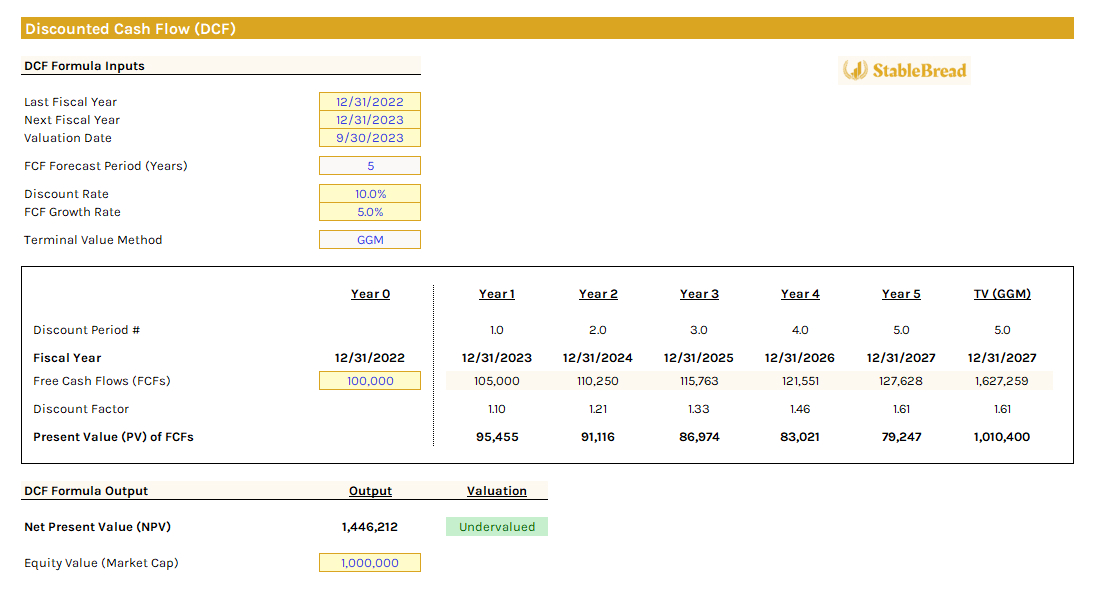
In the DCF model, the "Discount Period #" row lists integers from 1 to 5, representing a five-year forecast. The "Fiscal Year" row indicates the fiscal year-end dates when the company releases its financial results. In our case, this is December 31st. If the fiscal year-end were September 30th, the dates would be listed as "09/30/2022," and so on, reflecting the end of each fiscal period. The present value for each year is calculated by dividing the expected free cash flow (FCFn) by "(1 + re)n," considering the time value of money.
By summing the present values of the FCFs over five years and adding the terminal value calculated with the Gordon Growth Model (GGM) at a 2% terminal growth rate, we arrive at a net present value (NPV) of $1,446,212. When compared to the firm's assumed equity value (market cap) of $1,000,000, this suggests that the company is undervalued.
Now, the issue with the standard DCF approach is that it often discounts future cash flows too aggressively, assuming that the total value of each year's cash flow is realized at fiscal year-end. The mid-year convention/discounting approach offers a more nuanced and accurate method for company valuation. It assumes cash flows are received at the midpoint of every fiscal year, rather than at the end. We'll discuss this in more detail in the next section.
Discounted Cash Flow: The Mid-Year Convention Approach
The mid-year convention in a discounted cash flow (DCF) model adjusts the calculation of discount periods. Instead of standard whole numbers (1, 2, 3, etc.) for discounting future cash flows, it uses fractional periods (0.5, 1.5, 2.5, etc.). This approach better reflects the reality that businesses typically generate cash throughout the year, rather than only at year-end. By assuming cash flows occur around the middle of each annual period, like on June 30th instead of December 31st, the mid-year convention offers a more realistic depiction of cash flow timing.
In DCF analysis, the mid-year convention assumes cash flows at the midpoint of each year. Therefore, the discount factor formula is adjusted to include "- 0.5" in the exponent, as shown below:
Discount Factor (Mid-Year Convention) = FCFn / (1 + re)(n - 0.5)
Revisiting our previous example, incorporating the mid-year convention alters the discount periods (now reduced by 0.5), forecast dates (shifted to June 30th instead of December 31st), and the present value of FCFs (now increased across all five years due to the modified discount factor).
Here's the completed DCF model reflecting these changes (with mid-year convention):

The DCF model above omits the terminal value calculation, a significant factor in determining the firm's valuation. This omission is due to the variability in the discount period for the final year based on the terminal value calculation method used. It will either match the final mid-year discount period number (4.5 in our case) or the total years in the forecast period (5.0 in our case). This differs from the conventional DCF approach where, using whole numbers, the final discount period for the terminal value always matches the number of forecast years. These topics are discussed more in-depth below.
Mid-Year Convention Implication on Terminal Value
Terminal value (TV) represents the value of a business beyond the explicit forecast period. It's a significant component in discounted cash flow (DCF) valuation models, essential for capturing the bulk of a company's value.
Terminal value calculation methods generally fall into two main categories: the perpetuity growth approach and the exit multiple approach. This is relevant to mid-year convention, as depending on which approach you select, the period number at which free cash flows (FCFs) are discounted by will either be equal to the mid-year discounted period or the period at the end of the forecast period.
For a more in-depth explanation of estimating terminal value in DCF valuation models, read the article linked above. The section below will briefly discuss these terminal value calculation methods.
Perpetuity Growth Approaches
These approaches assume that a business will continue generating cash flows indefinitely, at a constant or zero growth rate.
Gordon Growth Model (GGM)
The Gordon Growth Model (GGM), or perpetuity growth method, assumes a company grows at a constant rate forever. This model is particularly suitable for cyclical companies or those with a strong economic moat. Often resulting in higher terminal values, the GGM is a preferred choice for valuing mature, predictable companies when long-term growth is anticipated to remain steady.
Here's the GGM formula for calculating terminal value:
TV (GGM) = FCFn * (1 + g) / (re - g)
where:
- TV = terminal value
- FCFn = free cash flow for the last 12 months of the forecast growth period
- g = estimated annual growth rate
- re = discount rate (required rate of return)
In our conventional DCF model example, we used the GGM to calculate the terminal value. With a year 5 FCF of $127,628 (FCFn), a terminal growth rate (g) of 2%, and a discount rate (re) of 10%, the terminal value was determined to be $1,627,259 (($127,628 * (1 + 2%)) / (10% - 2%)).
No-Growth Perpetuity Method
The No-Growth Perpetuity Method is ideal for large, established companies in competitive industries, where growth slows and excess returns approach zero. It assumes the company will stop growing after the forecast period, but will continue generating steady cash flows indefinitely. This method is simpler and often preferred for stable companies in slow-growth sectors.
Below is the no-growth perpetuity formula to calculate terminal value:
TV (NGP) = FCFn / re
where:
- TV = terminal value
- FCFn = free cash flow for the last 12 months of the forecast growth period
- re = discount rate (required rate of return)
For our example, with a year 5 FCF of $127,628 (FCFn) and a discount rate (re) of 10%, the terminal value would be $1,276,280 ($127,628 / 10%).
Perpetuity Growth Approach: Impact on Mid-Year Terminal Value Discount Period
The modified intrinsic value formula for a DCF model, incorporating the mid-year convention and a terminal value calculated with a perpetuity growth approach, is shown below:
PV0 = [FCF1 / (1 + re)(1 - 0.5)] + [FCF2 / (1 + re)(2 - 0.5)] + … + [FCFn / (1 + re)(n - 0.5)] + [TV / (1 + re)(n - 0.5)]
In a DCF model using the mid-year convention for perpetuity growth approaches, the terminal year's discount period is set to the last year's number minus 0.5. This adjustment acknowledges that cash flows, including the terminal value, are realized around the mid-point of the fiscal year, rather than at the end. Such discounting of the final year's free cash flow and terminal value six months earlier than standard models provides a more accurate reflection of the continuous nature of cash flows in these scenarios.
In our case study, we use 4.5 as the discount period number instead of 5.0. This adjustment is shown in the completed DCF model below (using GGM over NGP for the TV calculation):

Here, the "Mid-Year Discount Period #" after year 5 is 4.5. This implies the mid-year discount factor is the same as in year 5, influencing the mid-year present value calculation of FCFs. Summing these present values for each year, including the terminal value, yields an NPV of $1,516,800, higher than the conventional DCF model's NPV of $1,446,212. This higher NPV, compared to the conventional DCF model, suggests a greater degree of undervaluation relative to the firm's assumed market cap of $1,000,000.
Exit Multiple Approaches
These approaches involve applying a multiple to a financial metric at the end of the forecast period. It's commonly used due to its simplicity and alignment with market valuations.
Exit Multiple Method #1
The first exit multiple method calculates the terminal value by applying a trading multiple, often EV/EBITDA, to a financial metric like EBITDA for the last projected year. This method is particularly useful for companies expected to be less operational or profitable at the end of the forecast period, making it suitable for less predictable businesses.
Below is the traditional exit multiple approach for calculating terminal value:
TV (EMM M#1) = Financial Metric (EBIT or EBITDA) * Trading Multiple (i.e., EV/EBITDA)
where:
- TV = terminal value
- EBIT = earnings before interest and taxes
- EBITDA = earnings before interest, taxes, depreciation, and amortization
We'll avoid this method in the article, as it involves multiple financial assumptions.
Exit Multiple Method #2
The second exit multiple method, although less common, uses the final year's projected free cash flow (FCF) from the DCF model as the basis for the terminal value calculation, instead of EBIT or EBITDA, as shown below:
TV (EMM M#2) = FCF * Trading Multiple
where:
- TV = terminal value
- FCF = free cash flow for the last 12 months of the forecast growth period
In this method, the final FCF is multiplied by a chosen trading multiple, which we'll assume to be 5-times, in line with our five-year forecast period. This suggests selling the business at the end of the period for a value equal to five times the final year's cash flow, projecting a lump-sum return and reflecting the anticipated value of the business after five years. With our year 5 FCF of $127,628 (FCFn), multiplying this by 5.0x yields a terminal value of $638,141.
Exit Multiple Approach: Impact on Mid-Year Terminal Value Discount Period
The modified intrinsic value formula for a DCF model, incorporating the mid-year convention and a terminal value calculated with an exit multiple approach, is shown below:
PV0 = [FCF1 / (1 + re)(1 - 0.5)] + [FCF2 / (1 + re)(2 - 0.5)] + .... + [FCFn / (1+re)(n - 0.5)] + [TV / (1 + re)n]
Unlike the perpetuity growth approach, the terminal value as an exit multiple disregards the mid-year discounting convention for the terminal value discount period. This stems from the exit multiple's terminal nature; it assumes the company is sold at the end of the projected period, receiving the cash at the sale time (year n), not half a year earlier.
In our case study, the discount period number used is 5.0 instead of 4.5. This adjustment is evident in the completed DCF model below (using EMM M#2 over EMM M#1 for the TV calculation):
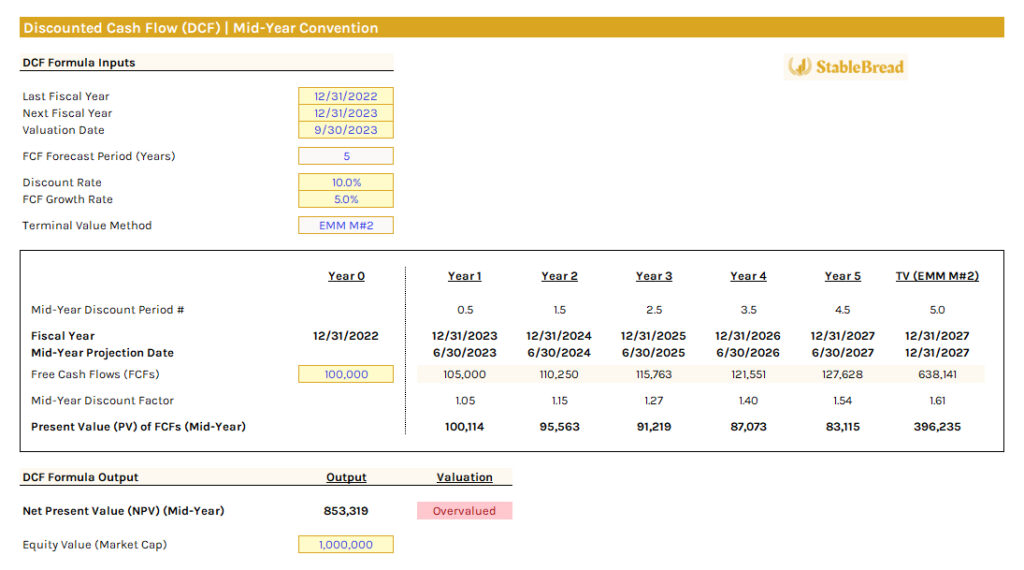
Here, the "Mid-Year Discount Period #" after year 5 is 5.0. Summing the present values for each year, including the terminal value, yields an NPV of $853,319, significantly lower than the previous model's $1,516,800. This reduction, driven by the exit multiple method's 5.0x multiplier assumption, and falling below the firm's assumed market cap of $1,000,000, indicates the stock is now considered overvalued.
Mid-Year Convention Impact on Valuations
Applying the mid-year convention in discounted cash flow (DCF) models notably affects company valuations. This method, by reducing the exponent in the discounting formula by 0.5, implies that cash flows are received earlier in the year, increasing each cash flow's present value and thereby elevating the company's overall valuation. The impact of this adjustment on valuation is influenced by two main factors:
- Length of Evaluation Period: The duration of the evaluation period is crucial. Mid-year discounting has a more pronounced effect over longer periods, such as annual DCF evaluations, compared to shorter ones like quarterly evaluations. The valuation impact diminishes for very short periods, converging nearly to zero as the time frame reduces from years to months or days.
- Size of Discount Rate: The discount rate's magnitude significantly influences the impact. Higher discount rates increase the effect of mid-year discounting, as the timing adjustment of cash flows becomes more meaningful. The higher the rate, the more substantial is the effect on valuation.
In practical terms, this means larger companies, with their substantial operations and cash flows, are more likely to see a noticeable difference in valuation between the two methods. Although the impact may be less evident in smaller companies, the distinction in valuation between mid-year and fiscal year-end discounting methods grows more apparent with increased cash flow scale and higher discount rates. This highlights the critical importance of the time value of money principle, emphasizing that cash flows received sooner hold greater value, thus theoretically increasing a company's valuation.
Mid-Year Convention Limitations
The mid-year discounting method in DCF modeling is generally more practical than end-of-year discounting, but it is not without its limitations. This approach presupposes that cash flows are evenly distributed throughout the year, which may not be accurate for companies with sporadic or irregular cash flows. This inherent imprecision in mirroring the true timing of cash flows represents a significant drawback of the mid-year convention.
While mid-year discounting is commonly used for its practicality, its suitability varies, especially for companies with distinct seasonal or cyclical cash flow patterns. For example, agricultural companies often experience significant variations in their cash flows due to the seasonal nature of farming and harvesting. Their revenues and expenses are heavily dependent on the agricultural cycle, with substantial income typically generated post-harvest. In such instances, the fiscal end-of-year discounting, which does not account for mid-year cash flows, might more accurately depict the company’s financial situation.
In short, the standardized method of mid-year convention, although beneficial in many situations, necessitates careful evaluation and possible adaptation when dealing with companies that have unusual or uneven cash flow patterns.
Mid-Year Convention With Stub Periods
In discounted cash flow (DCF) valuation models, a stub period accounts for a partial fiscal year at the start of the forecast. It's used when the valuation date doesn't align with the fiscal year-end, accurately capturing cash flows during this partial year and ensuring precise valuation timing. This is particularly useful in industries with seasonal cash flows or specific timing factors.
A stub period can be used with or without the mid-year convention. Without it, cash flows in the stub period are discounted based on their duration within the year. For instance, cash flows three months before the fiscal year-end would be discounted by 1/4th of a year. With the mid-year convention, cash flows are assumed to occur at the stub period's midpoint, refining the assumption that cash flows occur at the midpoint of each full fiscal year. Overall, this adjustment better represents cash flows in the first forecast year.
Below, we provide steps for incorporating stub periods into a DCF model, both with and without the mid-year convention, as this process can initially be somewhat tricky.
Step #1: Reduce Free Cash Flow Generated From First Year
Depending on the valuation date, a company may have already generated some or most of its cash flow for the first projected year, unless valuation occurs on January 1st. These realized cash flows should not be discounted to present value. Instead, the projected year 1 cash flows should be adjusted to exclude the amount already generated.
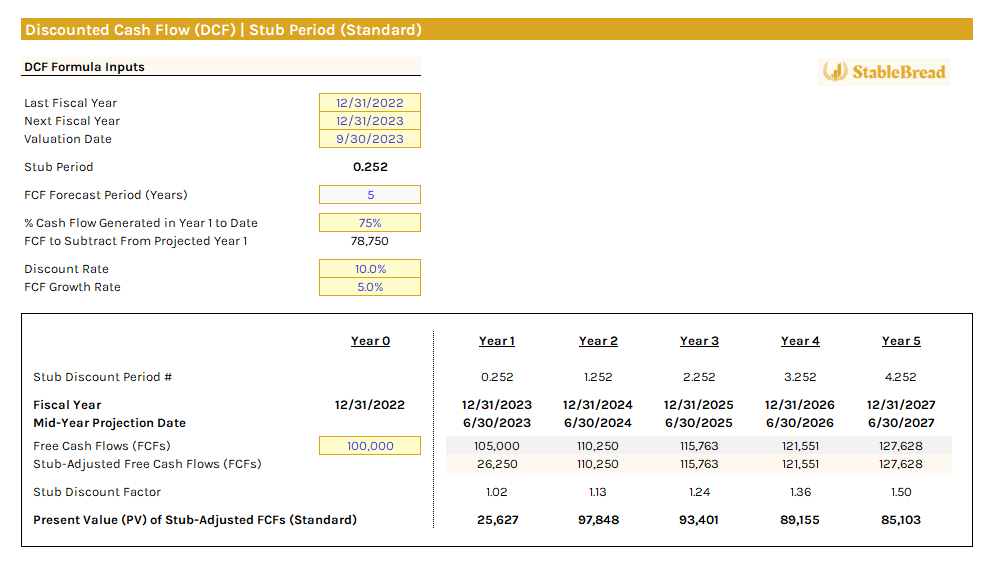
In our example, the valuation date is 09/30/2023, and the next fiscal year-end is 12/31/2023. The interval between these dates is the stub period. Assuming the $100,000 in free cash flow (FCF0) grows at 5% annually, the company is expected to generate $105,000 in FCF for the first year ($100,000 * (1 + 5%)).
If cash flows are generated uniformly throughout the year, 75% of this amount (9/12 months) is $78,750 ($105,000 * 75%), which represents the portion already generated and not subject to discounting. Therefore, you'd subtract this $78,750 from the $105,000, resulting in a stub-adjusted FCF of $26,250 for the first period in the DCF model. Notably, the projected cash flow for subsequent years (2, 3, and beyond) stays the same as in a typical DCF approach. This is because, as of 09/30/2023 (our valuation date), in year 1, these future years' cash flows haven't yet been generated.
Note, when valuing a company, the need for estimations on its free cash flow may vary. Often, this information is available or can be deduced from their 10-Q quarterly reports. This method is preferable to assuming that cash flows are generated evenly throughout the year.
Step #2: Calculate Stub Period Fraction
To calculate the stub period fraction, you can use the =DAYS function in Excel. Start with "=DAYS(Next Fiscal Year Date, Valuation Date)" to find the number of days between these two periods. To get the fraction of the year, divide this number by the result of another =DAYS function, "=DAYS(Next Fiscal Year Date, Last Fiscal Year Date)." This usually yields 365 in the denominator, representing the number of days in a typical year. The output of this calculation indicates the percentage of the year remaining between the valuation date and the next fiscal year date.
In our case, with the valuation date on 09/30/2023, the last fiscal year date on 12/31/2022, and the next fiscal year date on 12/31/2023, our stub period is 0.252. This means that just over 1/4 of the year remains between now and the next fiscal year-end (12/31/2023).
Step #3: Calculate Standard Stub Discount Period
In your DCF model, create a row for the stub discount period, representing the rate at which free cash flows (FCFs) will be discounted from the valuation date, without applying the mid-year convention.
For FY 2023, ending 12/31/2023 in our example, we use the remaining time in the year, which is our stub period (0.252). For each subsequent period after the first year, add +1 to the previous year's figure, following the conventional DCF approach. For example, in our 5-year forecast, our fifth-year normal discount period number would be 4.252 years (0.252 + 1.0 + 1.0 + 1.0 + 1.0).
Next, calculate the present value of the stub-adjusted FCFs as usual. Here's how this can be setup (also including steps #1 and #2 from above):
With this model built, we can apply the stub discount period with mid-year conventions, as discussed below.
Step #4: Calculate Stub Discount Period With Mid-Year Convention
In the first projected year (year 1), calculate the mid-year stub discount period by halving the stub discount period (0.252), resulting in 0.126 (0.252 / 2). This is done because the free cash flow (FCF) in this first year is assumed to arrive halfway through the year.
However, for each subsequent year, you should not halve the standard discount period. Doing so would inaccurately represent the timing of year 2 (and onwards) cash flows. Instead, for year 2, add 0.50 to the stub period, giving us 0.752 (0.252 + 0.50), signifying cash flows arriving mid-year. In year 3, the period becomes 1.752 (0.252 + 1.0 + 0.5), adding a full year for year 2 as no year 3 cash flows arrive in year 2—they arrive mid-year in year 3, hence the addition of 0.5. This pattern continues throughout the forecast period.
To simplify, besides the year 1 mid-year convention (half the standard stub discount period), every subsequent mid-year forecast is the standard stub period discount minus 0.5. For example, the standard second-year stub discount period is 2.252 years (0.252 + 1.0 + 1.0). Subtracting 0.5 gives 1.752, as calculated prior.
After calculating all mid-year stub discount periods, calculate the present value of the stub-adjusted FCFs as usual. Here's how this can be modeled:
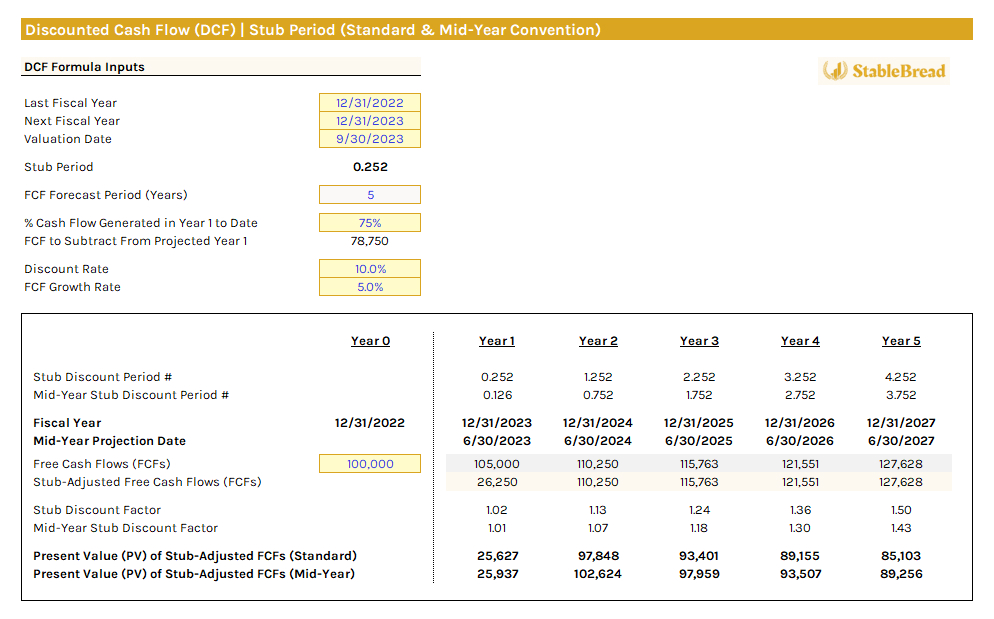
The final step involves assessing the impact on terminal value for stub periods, for both the standard approach and with mid-year conventions, as discussed below.
Step #5: Terminal Value Calculation With Stub Period Adjustments
The stub period affects the present value of the terminal value calculation by reducing the time between today's date and the end of the projection period. We previously discussed two primary methods for calculating terminal value: perpetuity growth and exit multiple.
Regardless of the terminal value calculation method chosen, the final year for the terminal value in a standard stub discount period always matches the last year's stub discount period. In our case, this is 4.252 in year 5 of our five-year forecast period.
When the stub period is combined with the mid-year convention, the discount period under the exit multiple method remains at the final year's mid-year stub discount period, which is still 4.252. However, under the perpetuity growth method, the discount period adjusts to 3.752 (4.252 - 0.5).
This adjustment is required because the perpetuity growth method, which relies on the company's cash flows, assumes these flows arrive halfway through each year under the mid-year convention. This is different from the multiplier approach used in the exit multiple method.
Overall, these approaches to terminal value are fairly consistent with the conventional DCF and standard mid-year discounting methods discussed earlier in this article.
Step #6: Calculate Net Present Value and Determine Valuation
The final step is to calculate the net present value (NPV) for the stub and mid-year stub discount periods, which is simply the sum of their respective present values of stub-adjusted free cash flows (FCFs). Using the Gordon Growth Model (GGM) as our terminal value calculation method and assuming a 2% terminal growth rate, we obtain an NPV of $1,476,191 for the standard stub and $1,494,340 for the mid-year stub. Comparing both to the assumed market cap of $1,000,000 implies that in either case, the stock is considered undervalued.
The completed DCF model, showing both stub discount period methods, is shown below:
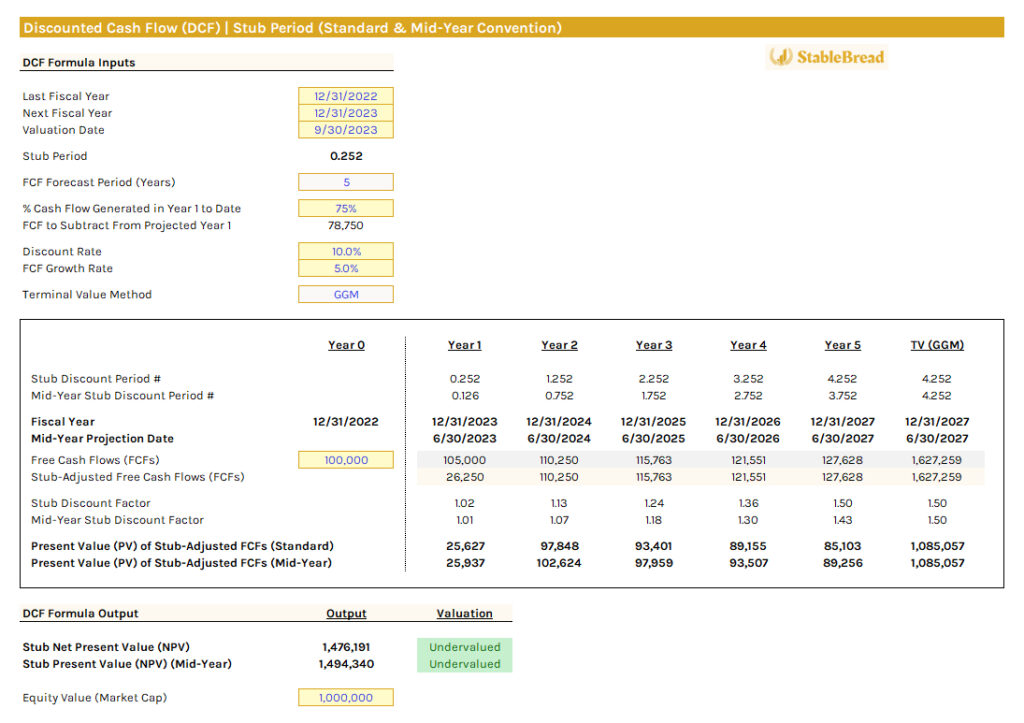
Here's a summary table of the calculated NPVs for all four DCF models we've put together in this article. All these methods use the GGM for the terminal value calculation:
As you can see, there's not a major deviation in the resulting NPV valuation of the company, which is generally why mid-year discounting and the stub period adjustment are not common in conventional DCF models.
The Bottom Line
The mid-year convention and stub periods refine discounted cash flow (DCF) valuations by better aligning with cash flow timings. The mid-year convention, assuming mid-year cash flows, raises valuations for businesses with evenly spread cash generation, offering a more conservative and precise assessment of the company. It is recommended for most DCF models but less suitable for firms with irregular cash flows, where traditional fiscal year-end discounting may suffice.
Stub periods address partial fiscal years at the start of the valuation, crucial for capturing early fiscal year events like major acquisitions. Although they minutely adjust valuations, integrating stub periods with mid-year discounting typically yields the most accurate valuation. While the overall influence of mid-year discounting and stub periods is generally minimal, they are useful in many cases but not required to make accurate investment valuation decisions.
