

Table of Contents
Relevant: How to Separate Accounting Value From Speculation Using Residual Earnings
REV Overview
The Residual Earnings Valuation (REV) tab is based on Stephen Penman's "Financial Statement Analysis for Value Investing" (2025).
Rather than speculating about long-term growth (as in DCF/DDM), this approach anchors valuation on book value and near-term earnings forecasts, then isolates what the market is paying for growth.
If a company earns returns above what shareholders require (ROE > cost of equity), it creates value. If below, it destroys value. The difference is residual earnings.
Key Formulas
Book value per share rolls forward by adding earnings and subtracting dividends:
BVPSt = BVPSt-1 + (EPSt - DPSt)
Return on equity for period t, based on beginning book value:
ROEt = EPSt / BVPSt-1
Residual earnings equals earnings minus a capital charge on beginning book value:
REt = EPSt - (r × BVPSt-1) = (ROEt - r) × BVPSt-1
Positive when ROE exceeds the required return (r), negative when it falls short.
Residual Earnings Valuation
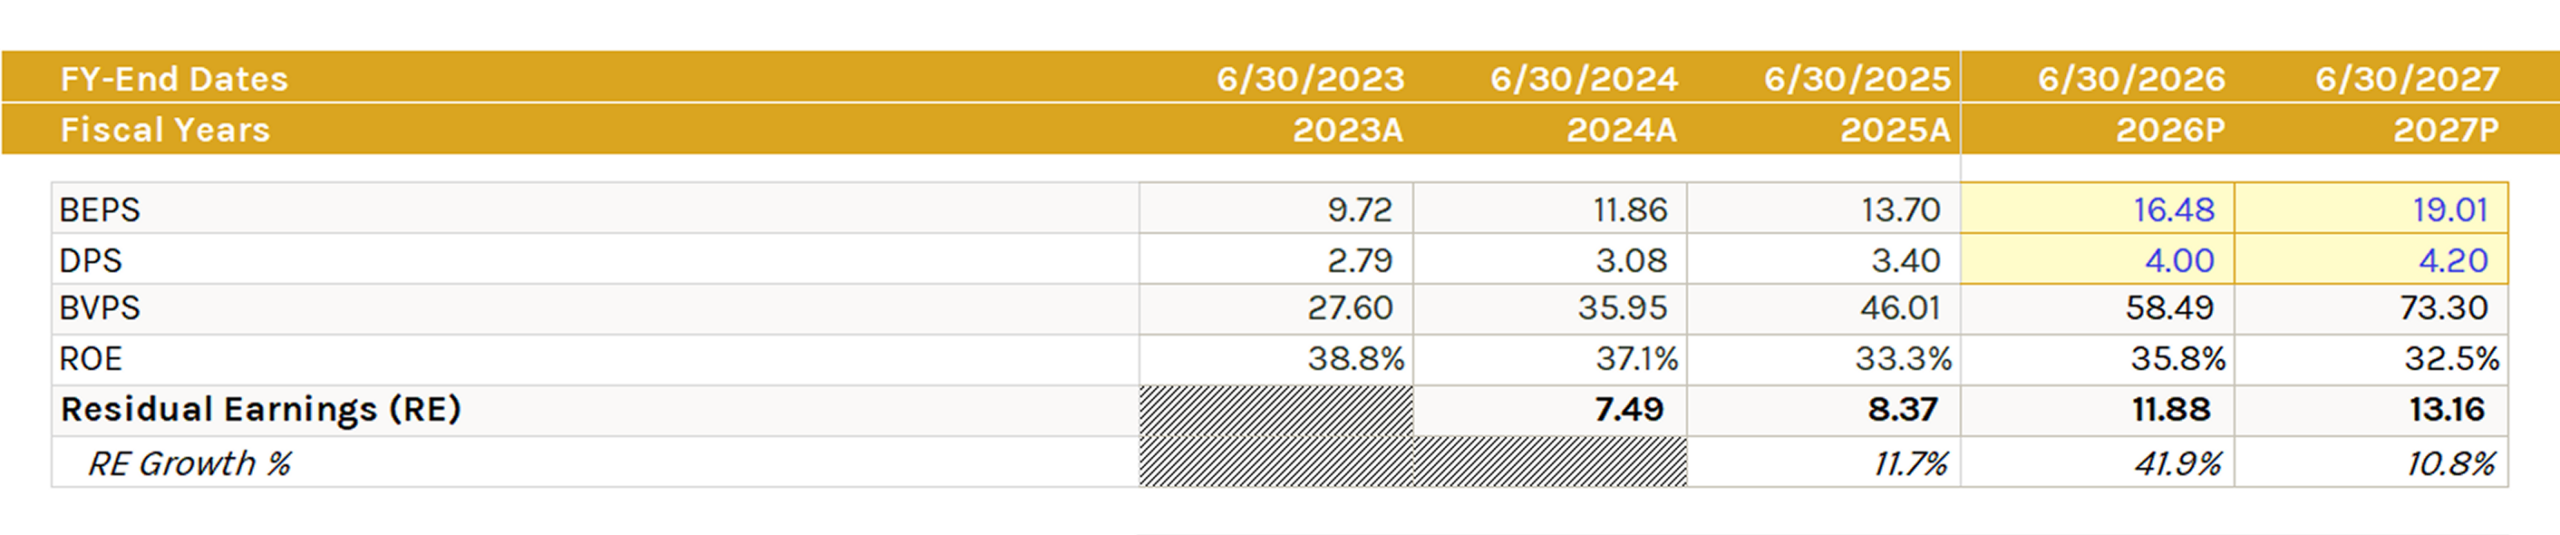
The model uses 3 years of actual data (BEPS, DPS, BVPS, ROE) and 2 years of projected data (user inputs for EPS and DPS estimates). A discount rate and RE growth rate are also required.
REV formula:
V0 = BVPS0 + PV(RE1) + PV(RE2) + PV(CV2)
CV2 = RE2 × (1 + g) / (r - g)
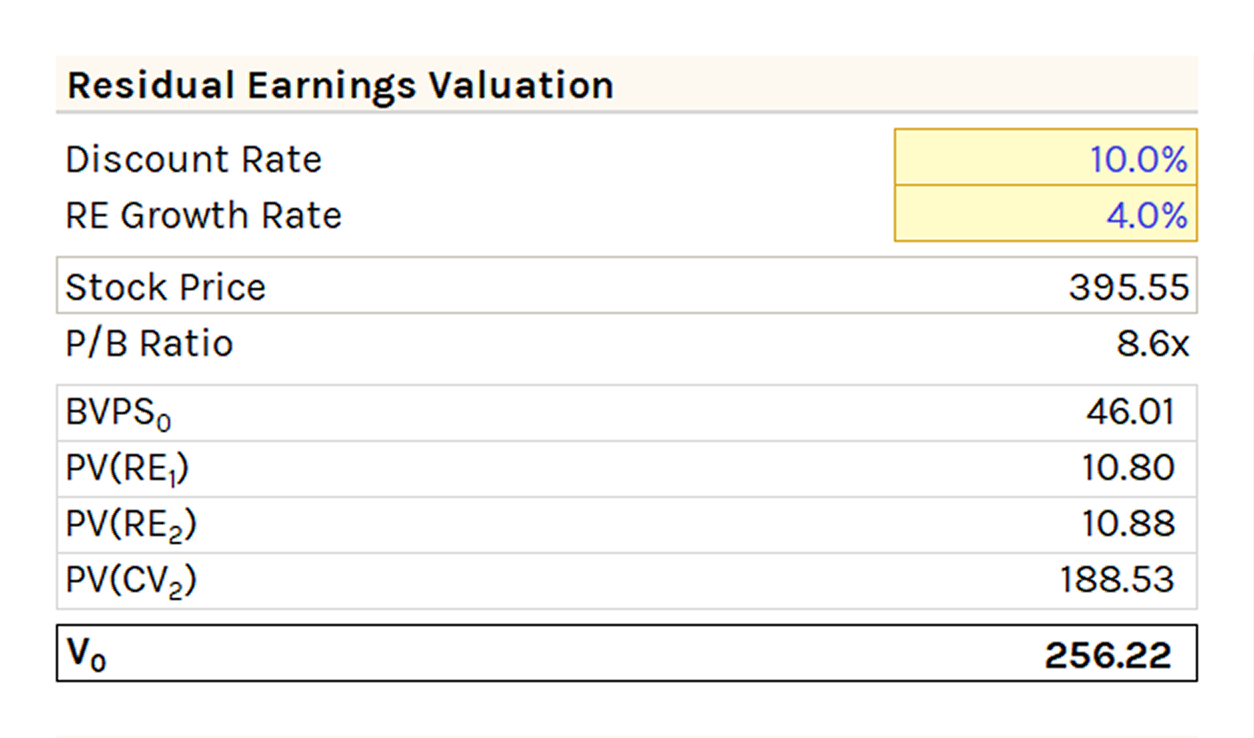
Starts with current book value, adds the present value of near-term residual earnings (1-2 years), then a continuing value (CV) for residual earnings beyond the forecast horizon.
No-Growth Valuation
Calculates what the stock would be worth if the company generated zero residual earnings growth going forward. Three versions provided: current year, 1-year out, and 2-year out.
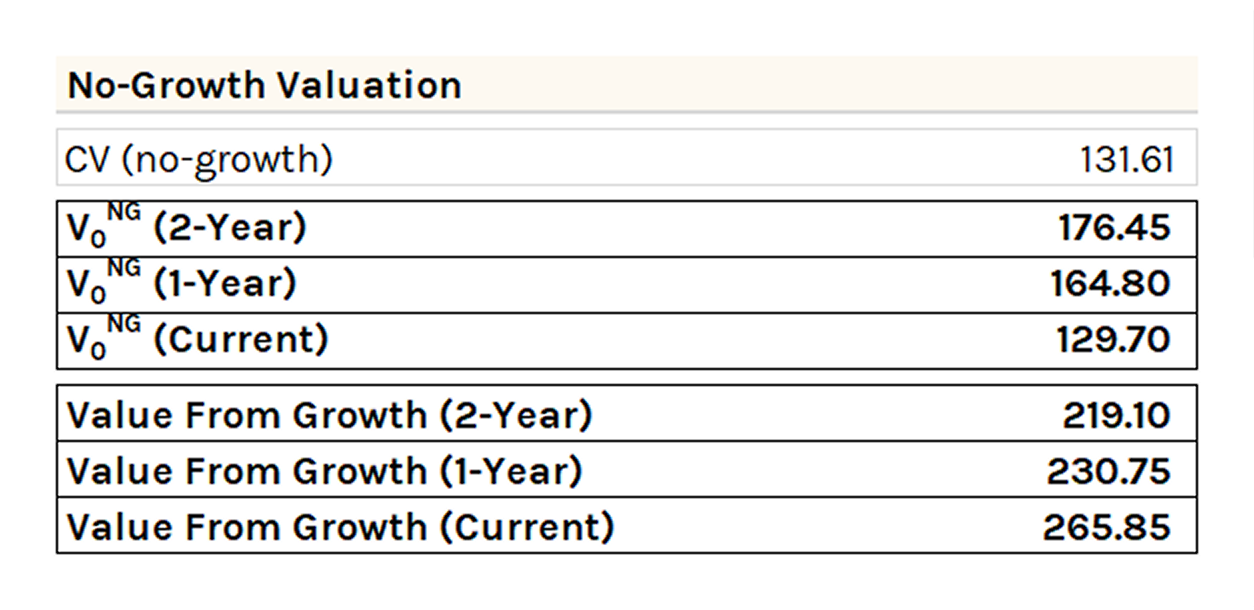
The difference between the stock price and the no-growth value represents what the market is paying for growth.
Components of Stock Price
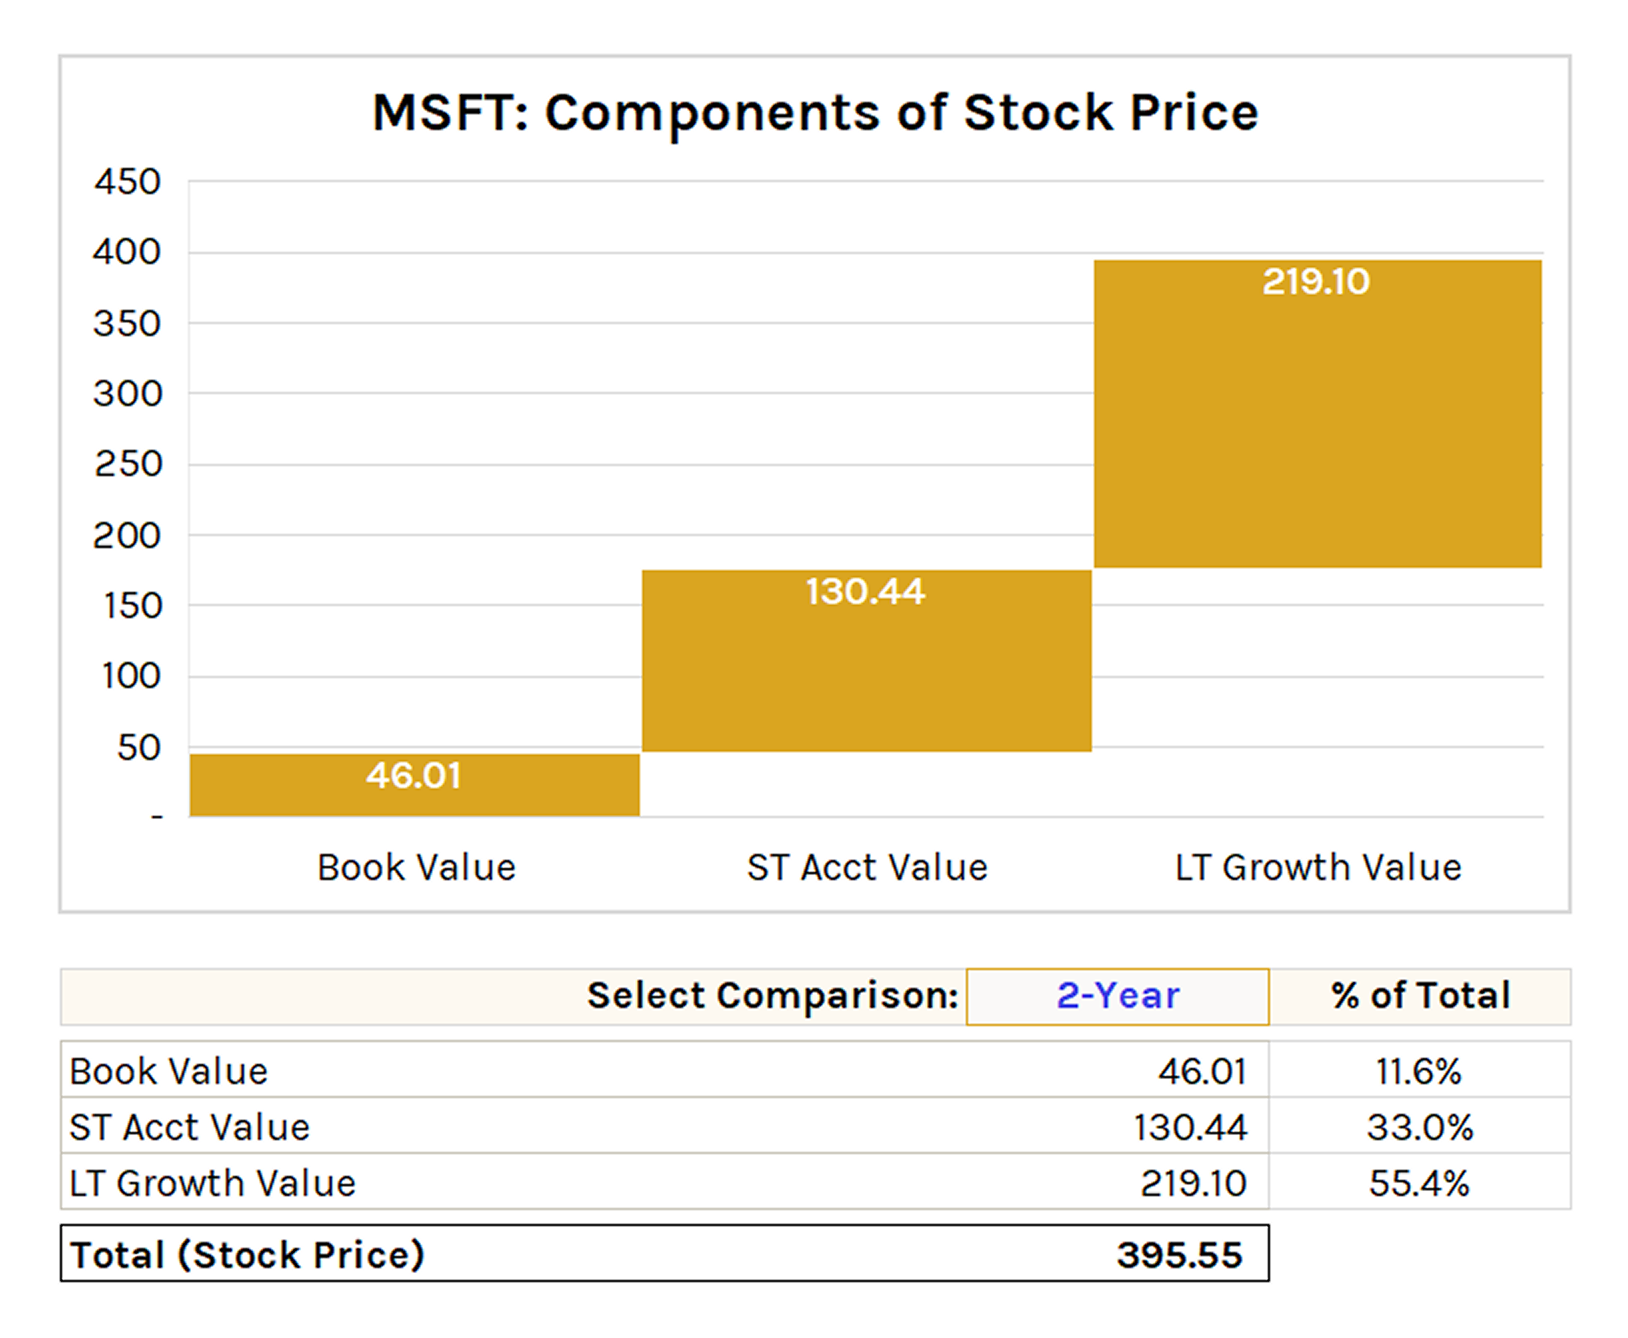
Waterfall chart that decomposes the stock price into three components (selectable between current, 1-year, and 2-year):
- Book Value: What the accounting statements say the company is worth.
- ST Acct Value: Near-term value added from forecast residual earnings.
- LT Growth Value: What the market is paying for long-term growth beyond the forecast. This is the speculative component.
Implied Growth Rate Analysis
Table and chart that reverse-engineer the implied RE growth rate at various stock price levels (adjustable via a price step input).
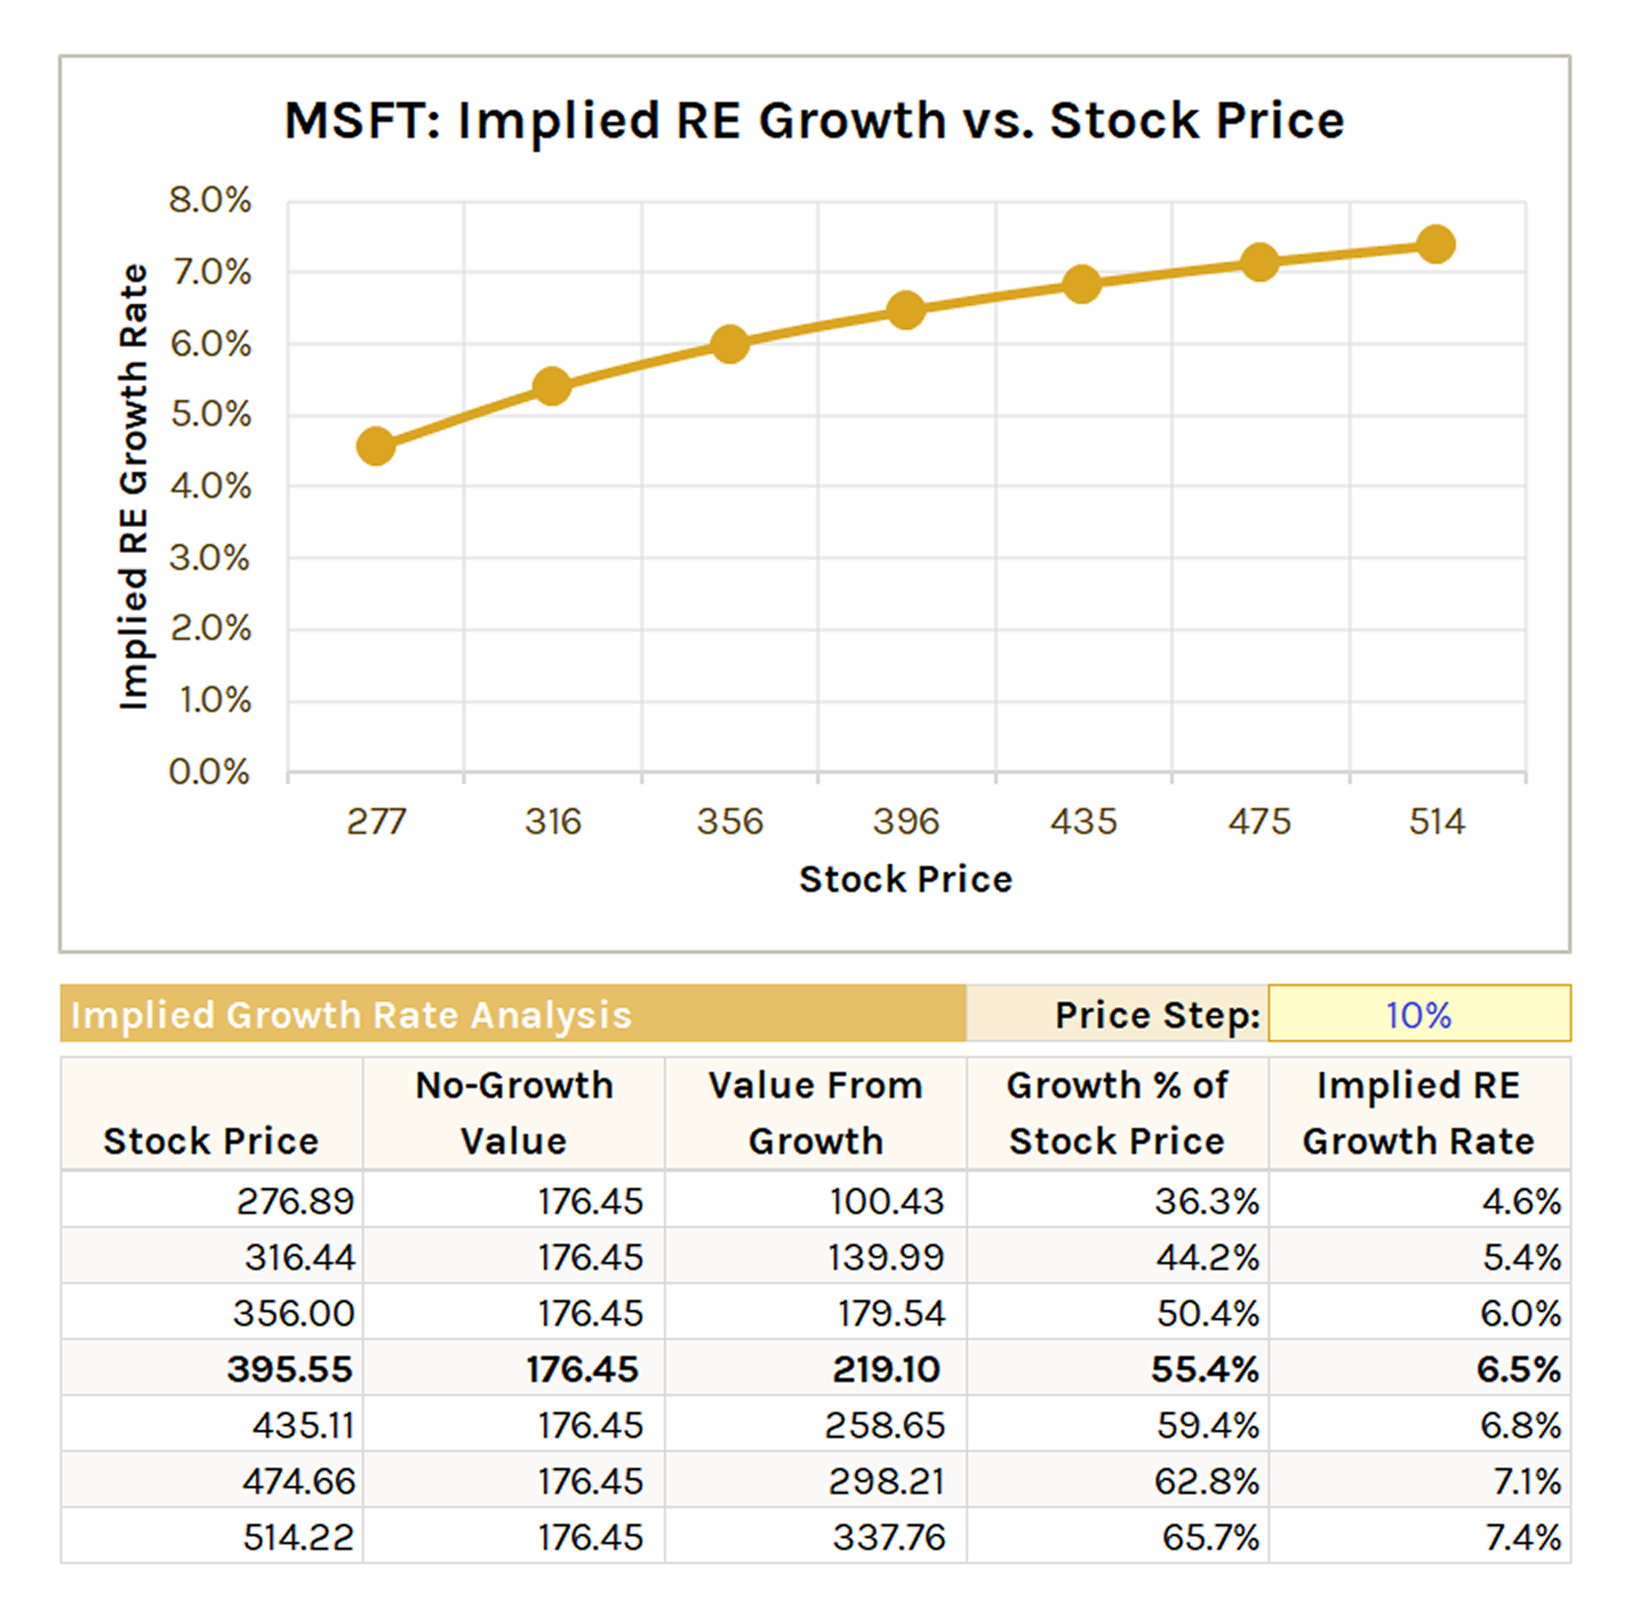
Shows the no-growth value, value from growth, growth as a % of stock price, and the implied RE growth rate for each price level.
Useful for answering: "At the current stock price, what growth rate is the market implying, and is that reasonable?"