

Table of Contents
Relevant: Relative Stock Valuation Articles
Comps Overview
Comparable company analysis (Comps) is a relative valuation model that estimates the value of a company by comparing its financial metrics to those of similar publicly traded companies.
This method assumes that comparable companies with similar business models, growth potential, and risk profiles should trade at similar valuation multiples.
Assumptions
- Comparable companies exist: Assumes the presence of publicly traded companies with similar business models, financials, and growth prospects to the company being valued.
- Market efficiency: Assumes the market efficiently values comparable companies.
- Consistent financial metrics: Relies on consistent and available financial metrics across comparable companies and the company being valued.
- Similar growth and risk: Assumes comparable companies have similar expected growth rates and risk profiles.
Relevant Applications
- Valuing private companies: Useful for valuing private companies or IPOs by providing a valuation benchmark based on similar public companies.
- Mergers and acquisitions: Frequently used in M&A to determine the fair value of a target company based on comparable companies' valuation multiples.
- Sector-specific valuation: Well-suited for comparing valuations within a specific sector or industry.
- Identifying mispriced securities: Helps identify potentially overvalued or undervalued stocks by comparing valuation multiples to peers.
Limitations
- Peer selection subjectivity: Subjective selection of comparable companies can significantly impact valuation results.
- Differences between companies: Perfect comparability is rare, and differences in business models, financials, or growth prospects can affect valuation accuracy.
- Limited applicability for unique companies: May not be suitable for valuing companies with unique business models or lack of clear public peers.
- Relies on market sentiment: Influenced by market sentiment and may not reflect intrinsic value if the market or sector is mispriced.
Step #1: Input Comparable Companies
The first step in a Comps valuation is identifying the right comparable companies.
Analyze the company's business and financial profile considering its industry/sector, product offerings, customer base, geographic presence, market size, profitability, growth profile, and credit profile.
Input the stock tickers of selected companies into the model (up to 10 tickers).
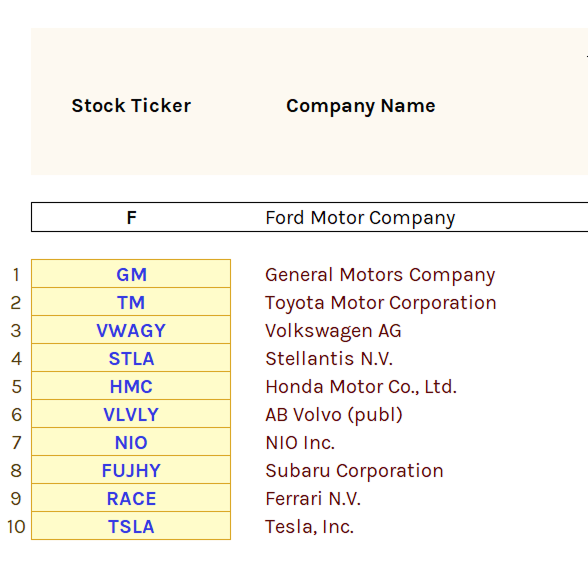
Note: This example is for illustrative purposes only. Some of these companies may not be suitable comparables for Ford.
Step #2: Configure Calendarization
Enable calendarization to standardize financial data across companies with different fiscal year-ends. This adjusts financial metrics to a common calendar year basis, ensuring accurate comparisons.
If 2024 is the Analysis Year, these are the years that can be calendarized:
- 2023 (year prior to Analysis Year)
- 2024 (Analysis Year)
- 2025 (forecast year)
Calendarization formula:
Calendarized Financial Data = [(Overlapping Months Prior FY / 12) × Prior FY Financial Data] + [(Overlapping Months Current FY / 12) × Current FY Financial Data]
Calendarization process:
- Prior FY Contribution: Multiply prior year's financial data by the fraction of the year that overlaps with the calendar year.
- Current FY Contribution: Multiply current fiscal year's financial data by its overlapping fraction.
- Add Contributions: Sum the prior and current FY contributions to get the calendarized financial data.
For example, Ford's FY ends 12/31/2024, matching the calendar year-end, so no adjustment is needed. Toyota's FY ends 03/31/2024, meaning 3 months overlap with 2024 and 9 months fall in 2025. The model calendarizes Toyota's Revenue, EBITDA, and Net Income accordingly.
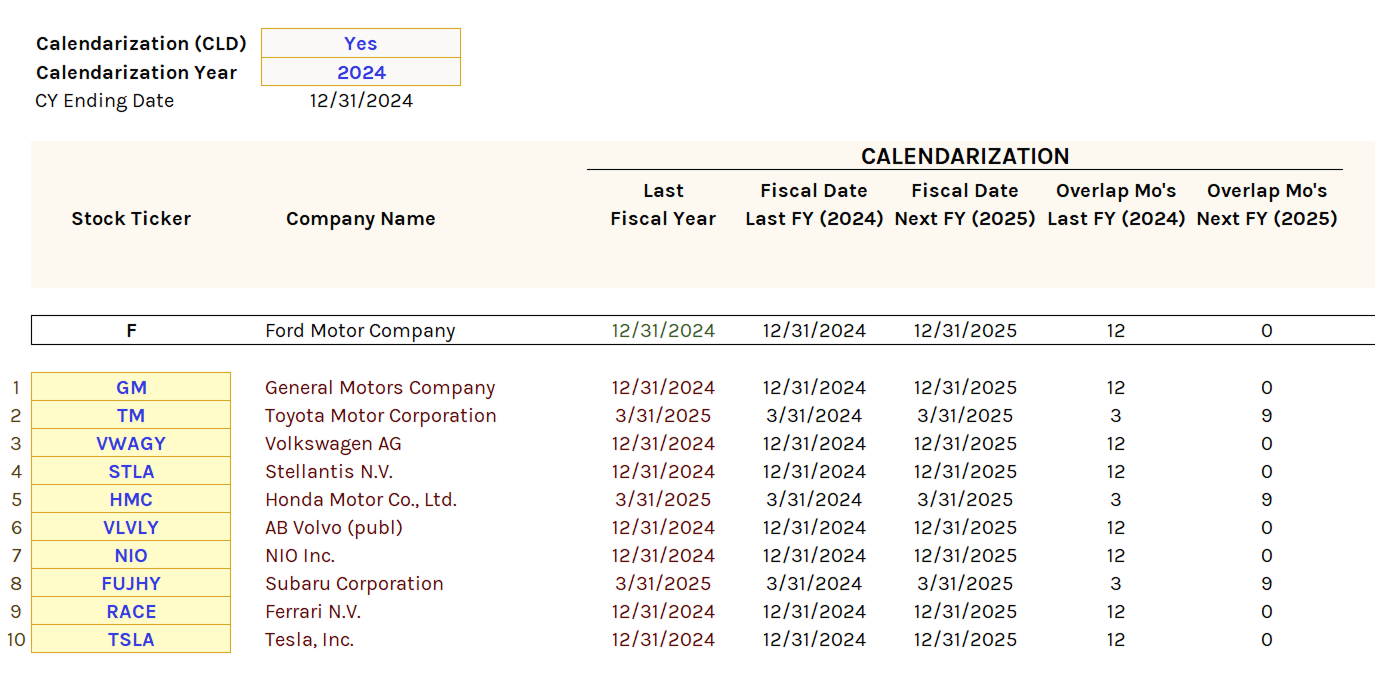
Note: Calendarization is applied automatically across every company in the model, but only for the calendarization year selected.
Step #3: Market Data
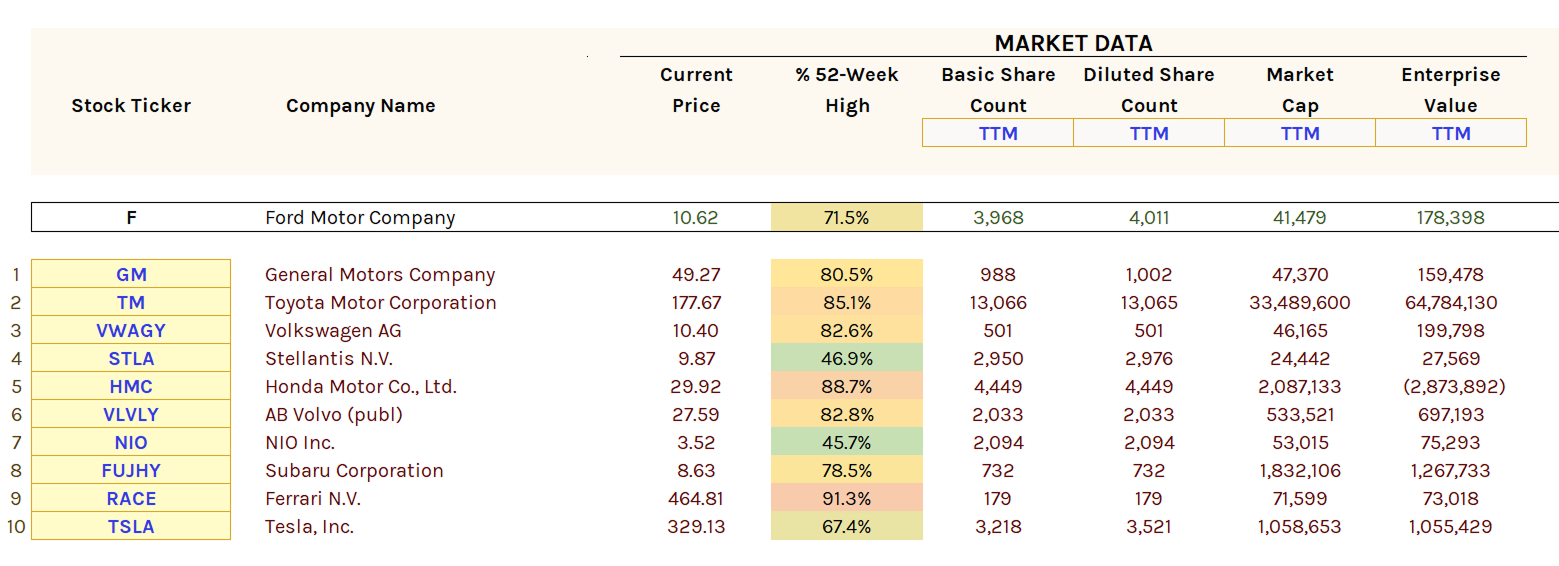
The model generates market data for each company:
- Current stock price and 52-week range position (higher percentages suggest overvaluation, highlighted by conditional formatting).
- Share counts (basic and diluted).
- Market size figures (market cap and enterprise value).
For all target and comparable companies, you can switch between last fiscal year data (based on Analysis Year) or TTM.
Step #4: Financial Metrics
The model outputs standard financial metrics:
- Revenues: Last three fiscal years
- EBITDA: Last two fiscal years
- Net Income: Last two fiscal years
Analyst estimates from Wisesheets are included for the next two forecast years. Select between Low, High, or Avg estimates.
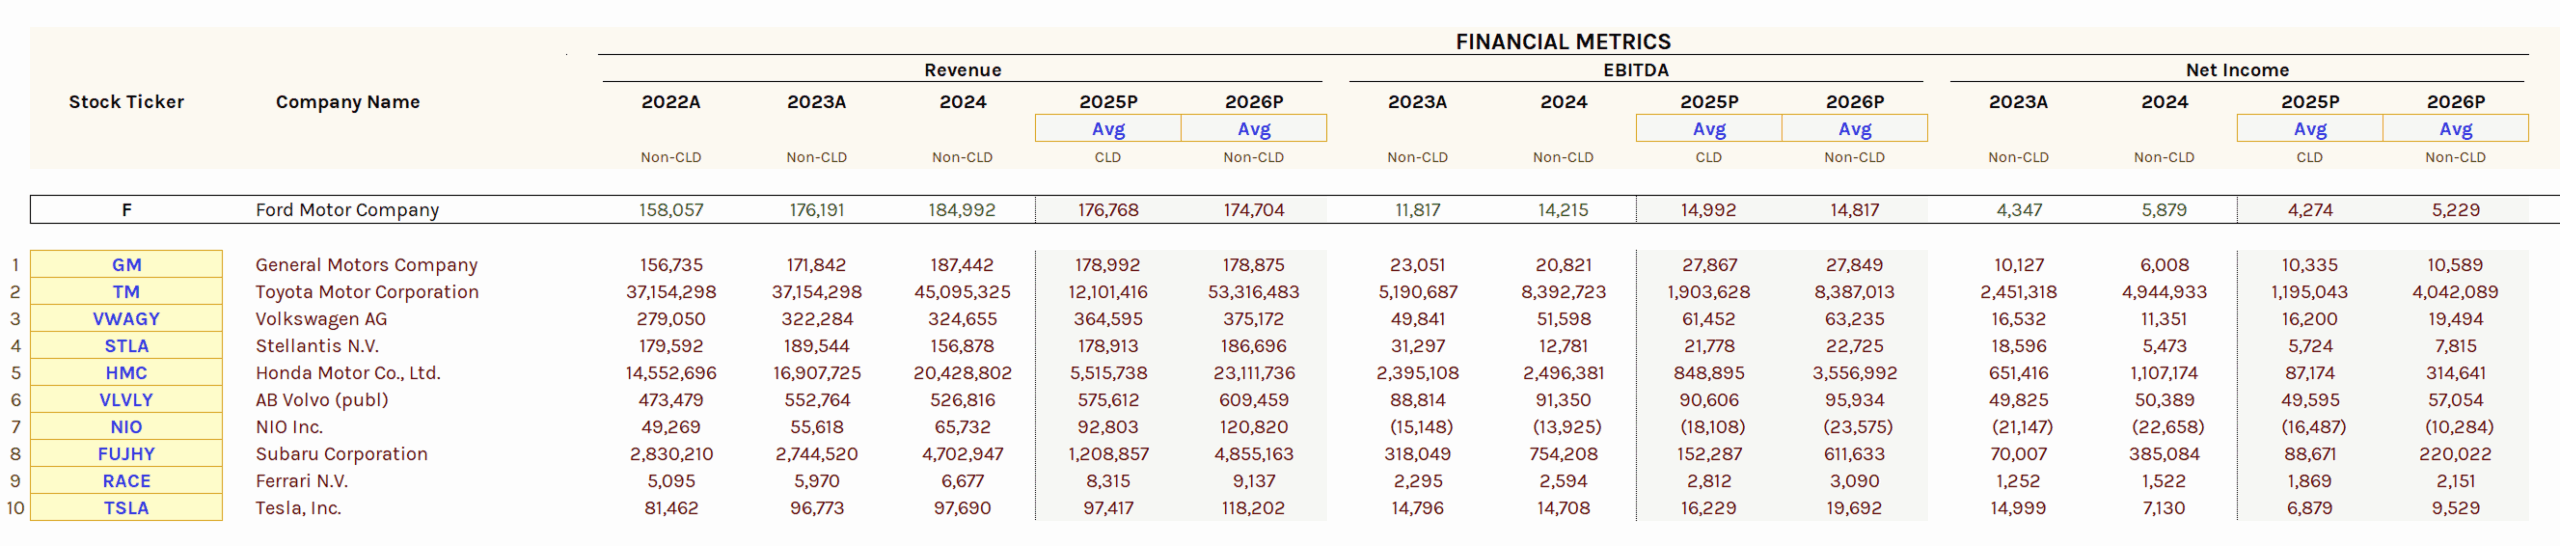
These metrics feed into the trading ratios and trading multiples calculations.
Note: Ignore the gray cells above the financial metrics. These are supplementary calculations for calendarization.
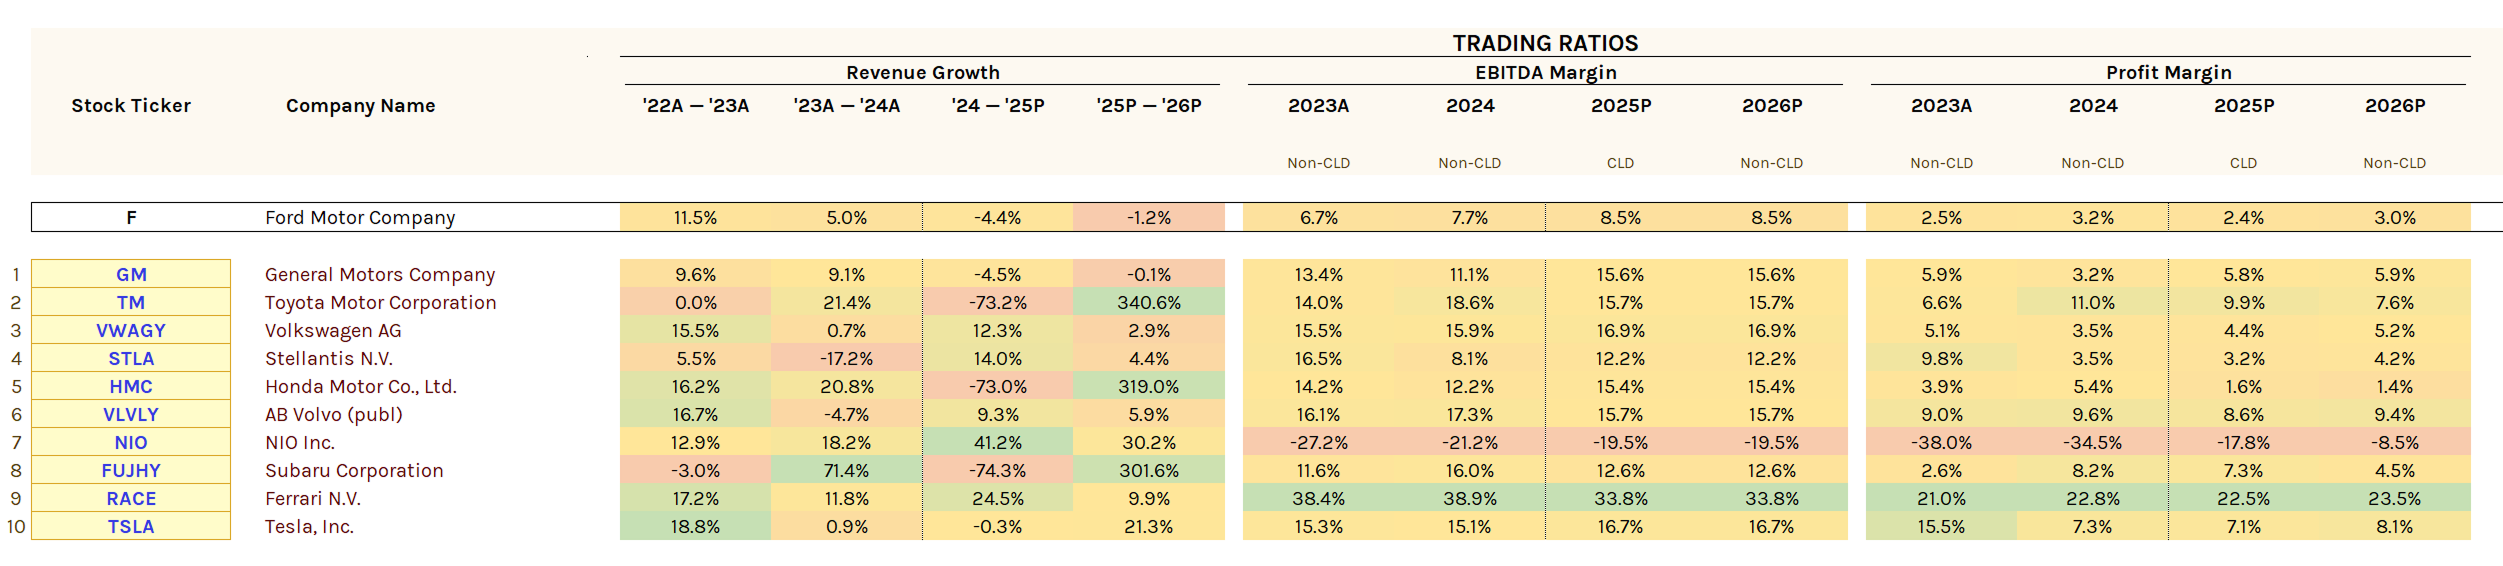
Step #5: Trading Ratios
The model calculates revenue growth, EBITDA margin, and net income margin for the target company and all comparables across the Analysis Year, preceding year, and next two forecast years.
Conditional formatting (red to green) where higher values are favorable.
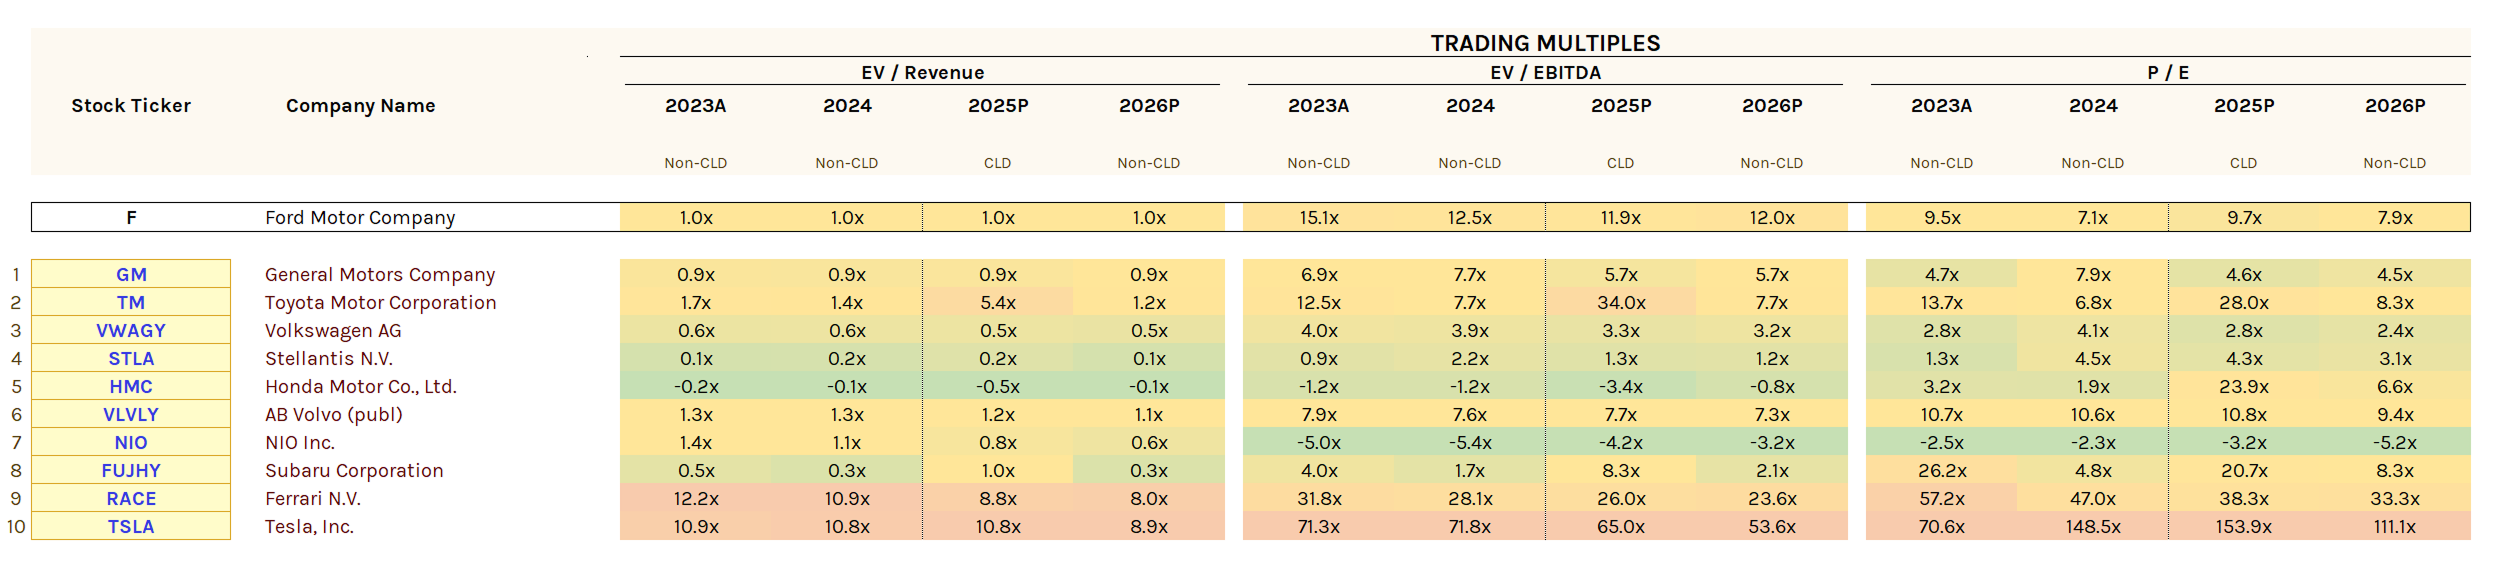
Step #6: Trading Multiples
The model calculates EV/Revenue, EV/EBITDA, and P/E for the target company and all comparables across the Analysis Year, preceding year, and next two forecast years:
- EV/Revenue: Enterprise value per dollar of revenue. Useful for comparing companies regardless of capital structure.
- EV/EBITDA: Enterprise value relative to EBITDA. Measures profitability and operational efficiency excluding financing and accounting decisions.
- P/E (Price-to-Earnings): Stock price per dollar of EPS. Reflects market growth expectations and profitability.
Unlike trading ratios, lower multiples are preferred (indicating potential undervaluation). Conditional formatting is reversed: green for lower, red for higher.
Step #7: Percentile Distribution
The model calculates the following statistics for each trading ratio and multiple across comparable companies:
- Maximum
- 75th percentile
- Mean
- Median
- 25th percentile
- Minimum
These are used to derive the target company's implied valuation in Step #8.

Step #8: Implied Valuation
The model calculates the target company's implied valuation based on the comparable companies and percentile distribution statistics (min, 25th, mean, median, 75th, max).
Historical Implied Valuation
For the Valuation Year, select the Analysis Year or preceding year.
Here's the process:
- References trading multiples (EV/Revenue, EV/EBITDA, P/E) from percentile distribution.
- Calculates implied enterprise values by multiplying target company metrics by corresponding multiples (for Revenue and EBITDA).
- Converts implied enterprise values to implied equity values (for Revenue, EBITDA, and Net Income).
Note: The Valuation Year selected should match the Calendarization Year (if enabled).

Implied Enterprise Value to Implied Equity Value
For Revenue and EBITDA:
Implied Equity Value (Revenue and EBITDA) = Implied Enterprise Value + Cash & Equivalents + Short-Term Investments - Total Debt - Minority Interest
For Net Income:
Implied Equity Value (Net Income) = (EPS × Shares Outstanding) × Implied P/E Ratio
You can choose between basic or diluted EPS. Basic uses actual outstanding shares, while diluted includes potential shares from convertible securities.
Implied per-share prices are calculated by dividing equity values by shares outstanding (basic or diluted). Within each option, choose between last fiscal year (Analysis Year) or TTM.
Mean and median values are typically the most reliable indicators.
Here's how valuation is determined:
- Undervalued: Implied Price > Stock Price
- Overvalued: Implied Price < Stock Price
The "Enable Price Comparison" dropdown applies conditional formatting: green for undervalued, red for overvalued.

Forward Implied Valuation
For the Valuation Year, select between the two years following the Analysis Year.
This section mirrors the historical implied valuation except:
- Select between Low, High, or Avg EPS estimates (from Wisesheets) instead of basic/diluted for the net income implied equity value.
- Input your own estimates for non-operating assets (cash & equivalents, short-term investments) and non-interest bearing liabilities (total debt, minority interest). Alternatively, reference historical values.