

Table of Contents
Relevant: Benjamin Graham Valuation Articles
Benjamin Graham Valuations Overview
The GRAHAM tab provides three Benjamin Graham valuation approaches:
- Graham Net-Net (NCAV and NNWC)
- Graham Number
- Graham Formula
Net-Net and Graham Number calculations share the same date range/periods as the KFS and KFR tabs, including quarterly data and NTM estimates. The Graham Formula covers the last three fiscal years and TTM.
Note: Price/NCAV, Price/NNWC, and Price/Graham Number ratios from this tab carry over to the KFR tab under the "Price" section.
Graham Net-Net
Graham's net-net strategy identifies companies trading below their liquidation value.
Two methods are provided:
Graham NCAV (Net Current Asset Value)
Graham NCAV estimates a company's conservative liquidation value by subtracting total liabilities from current assets:
NCAV = Current Assets - Total Liabilities - Preferred Stock - Off-Balance Sheet Items

The model calculates NCAV, NCAV per share, Price/NCAV, applies a user-defined margin of safety, and outputs a buy price with overvalued/undervalued label for each period.
Graham NNWC (Net-Net Working Capital)
Graham NNWC applies liquidation discounts to current assets, reflecting the reality that not all assets can be converted to cash at full value:
NNWC = Adjusted Current Assets - Adjusted Total Liabilities
where:
- Adjusted Current Assets = Cash & Equivalents + Short-Term Investments + (75% × Accounts Receivable) + (50% × Inventories)
- Adjusted Total Liabilities = Total Liabilities + Preferred Stock + Off-Balance Sheet Items
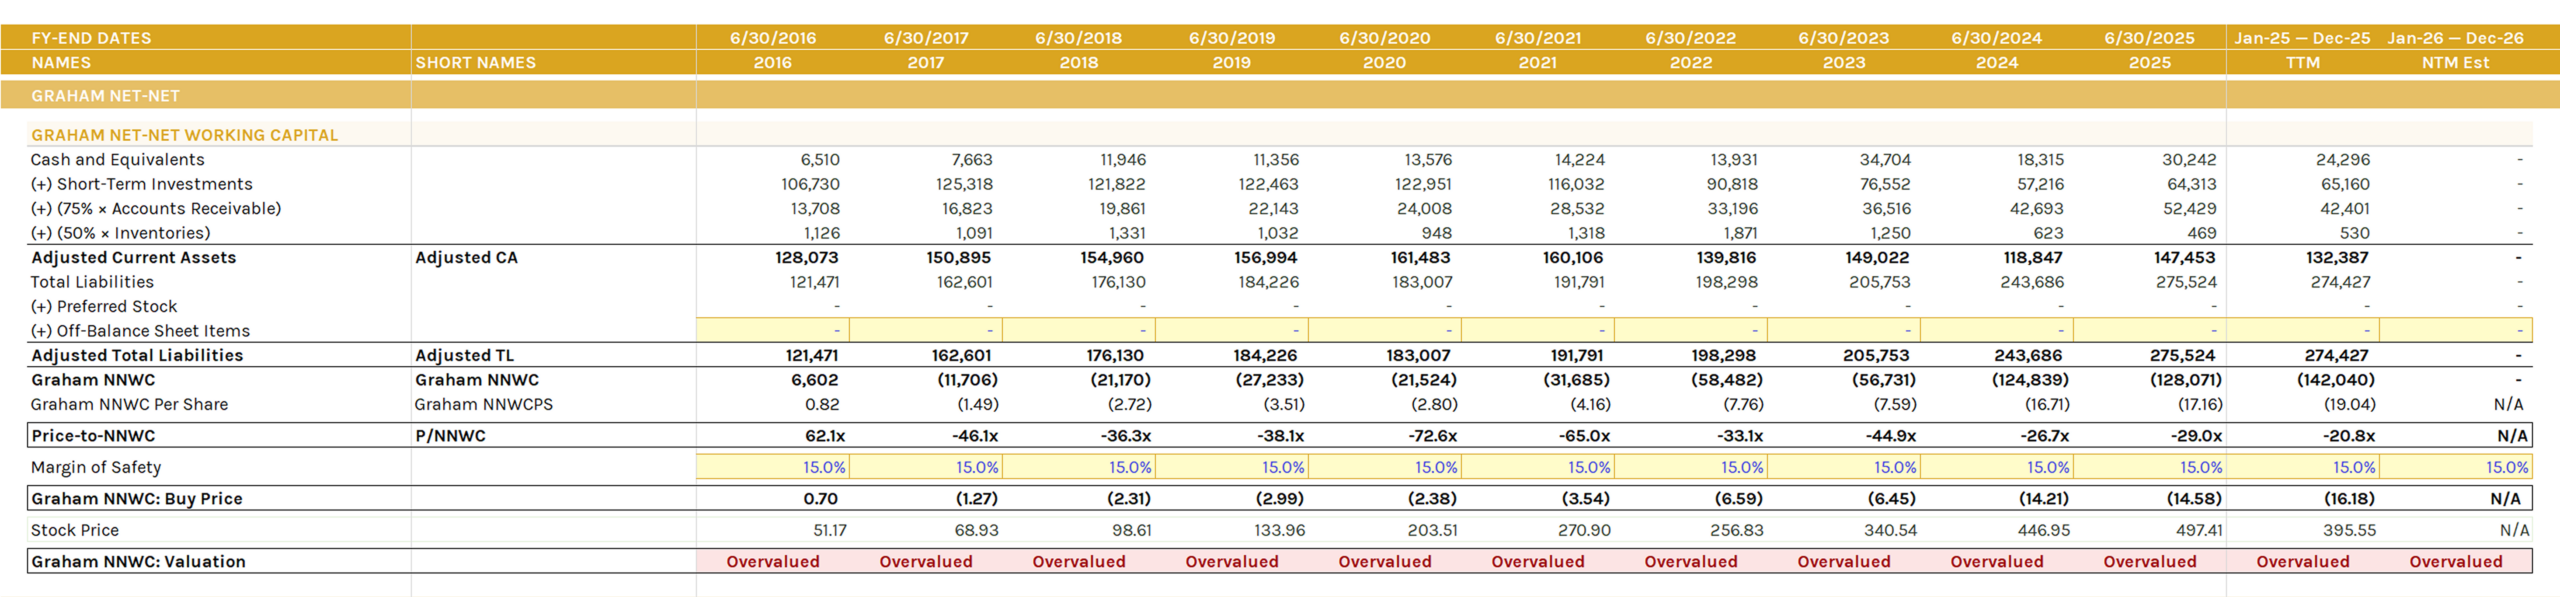
The model calculates NNWC, NNWC per share, Price/NNWC, applies a user-defined margin of safety, and outputs a buy price with overvalued/undervalued label for each period.
Graham Net-Net vs. Stock Price Chart
Plots stock price against NCAV and NNWC buy prices over time.
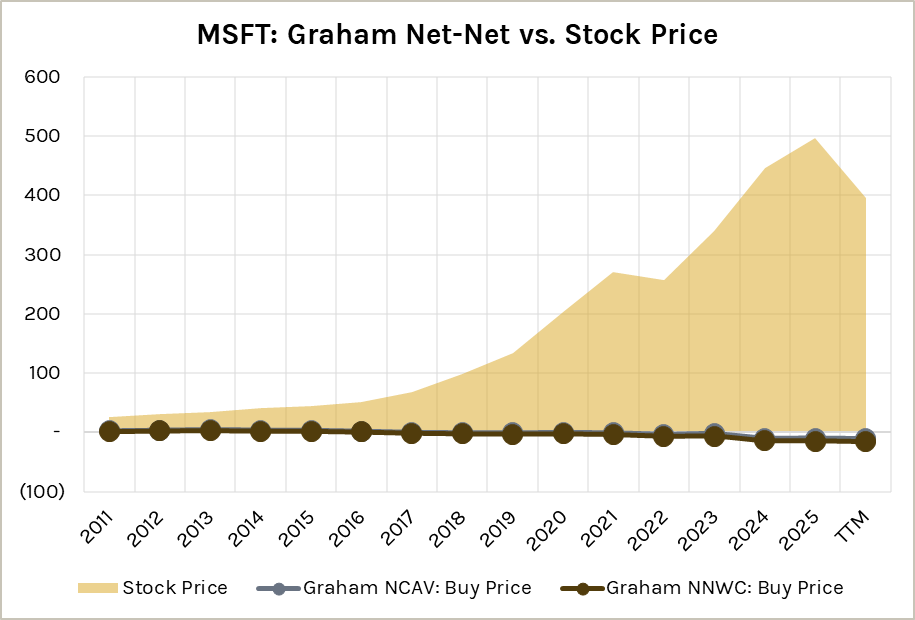
Useful for visualizing whether the stock has ever traded near or below liquidation value.
Graham Number
Estimates the maximum price a defensive investor should pay based on earnings and book value:
Graham Number = √(22.5 × Diluted EPS × BVPS)
where:
- 22.5 = 15 (max P/E) × 1.5 (max P/B) per Graham's defensive criteria.
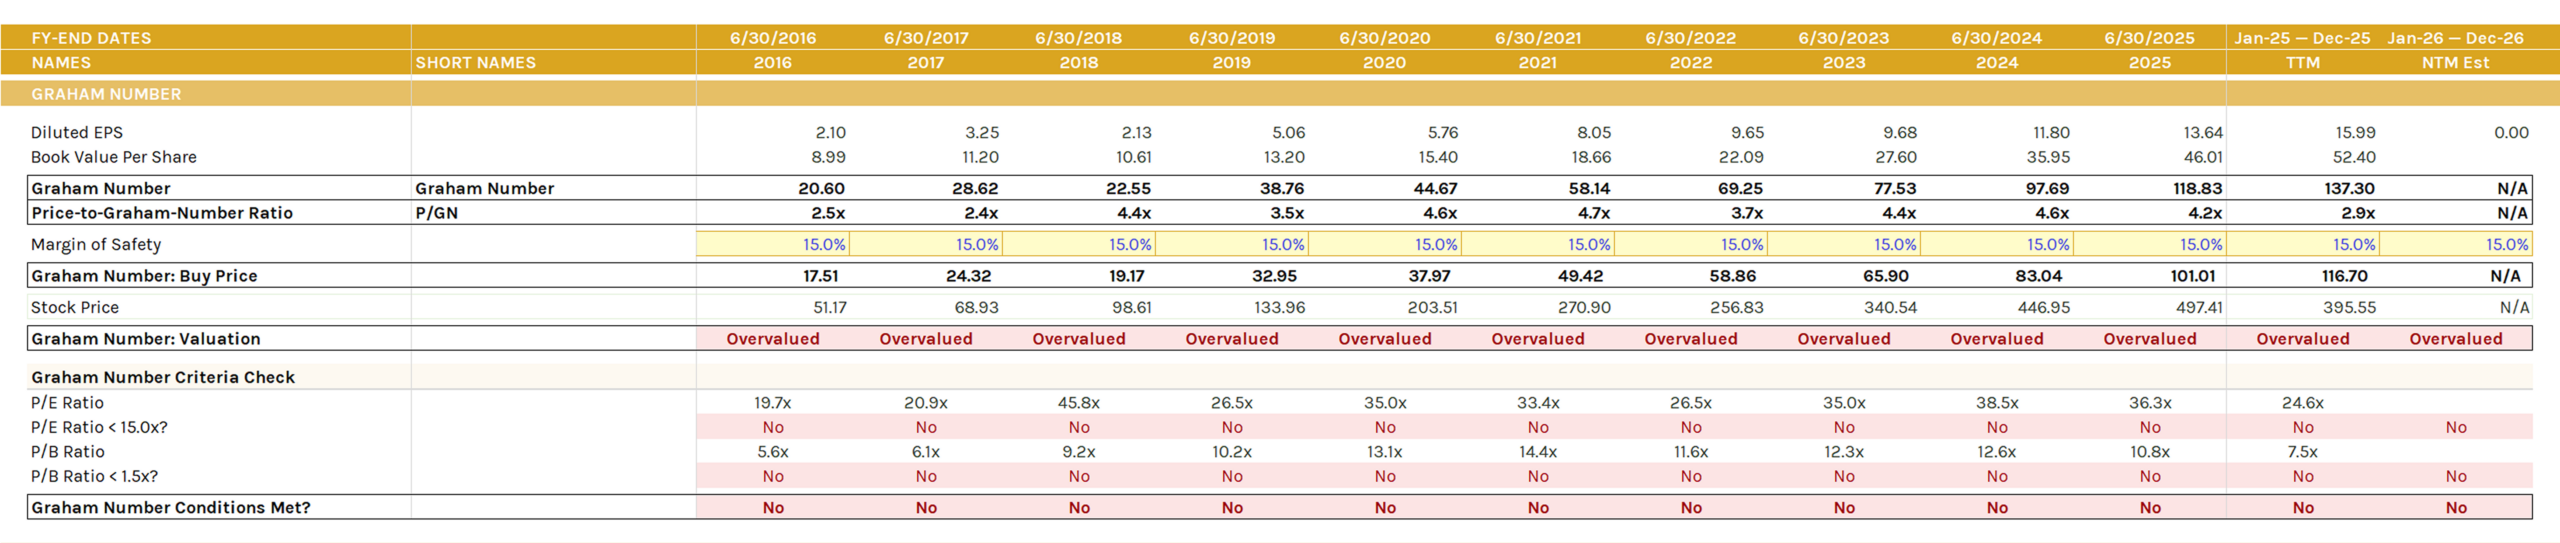
The model calculates the Graham Number, Price/Graham Number ratio, applies a user-defined margin of safety, and outputs a buy price with overvalued/undervalued label for each period.
Graham Number Criteria Check
Tests whether the stock meets Graham's defensive investor criteria for each period:
- P/E < 15.0x
- P/B < 1.5x
- "Graham Number Conditions Met?" = Yes only if both criteria pass.
Graham Number vs. Stock Price Chart
Plots stock price against the Graham Number buy price over time.
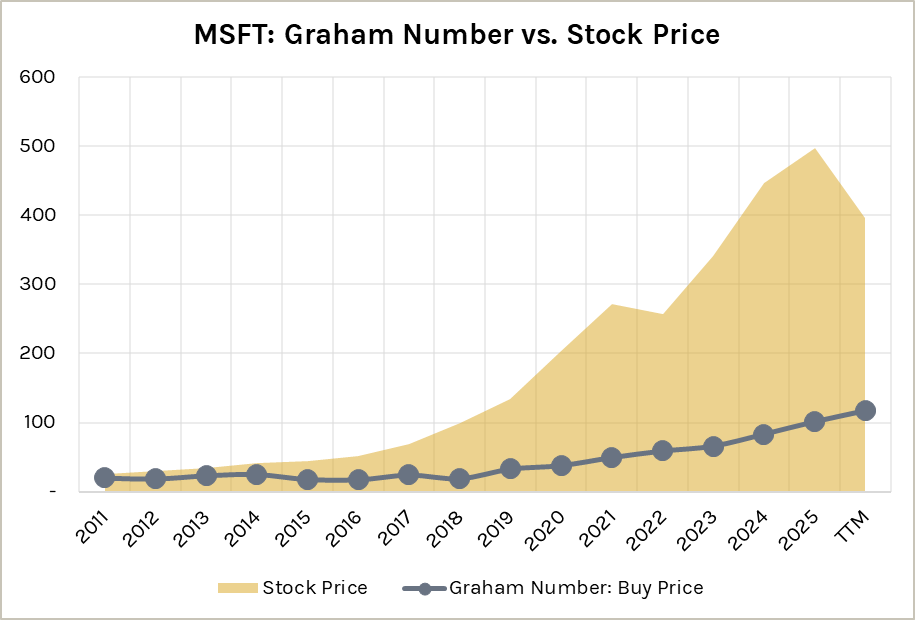
Useful for visualizing whether the stock has ever traded near or below Graham's maximum price.
Graham Formula
Estimates intrinsic value using Graham's revised growth formula:
V = (EPS × (8.5 + 1g) × 4.4) / Y
where:
- EPS = earnings per share (basic or diluted)
- 8.5 = P/E base for a no-growth company
- g = expected annual growth rate (next 7-10 years)
- 4.4 = historical average yield of AAA corporate bonds
- Y = current yield of AAA corporate bonds
All variables (except EPS) have input cells so you can adjust the formula dynamically.
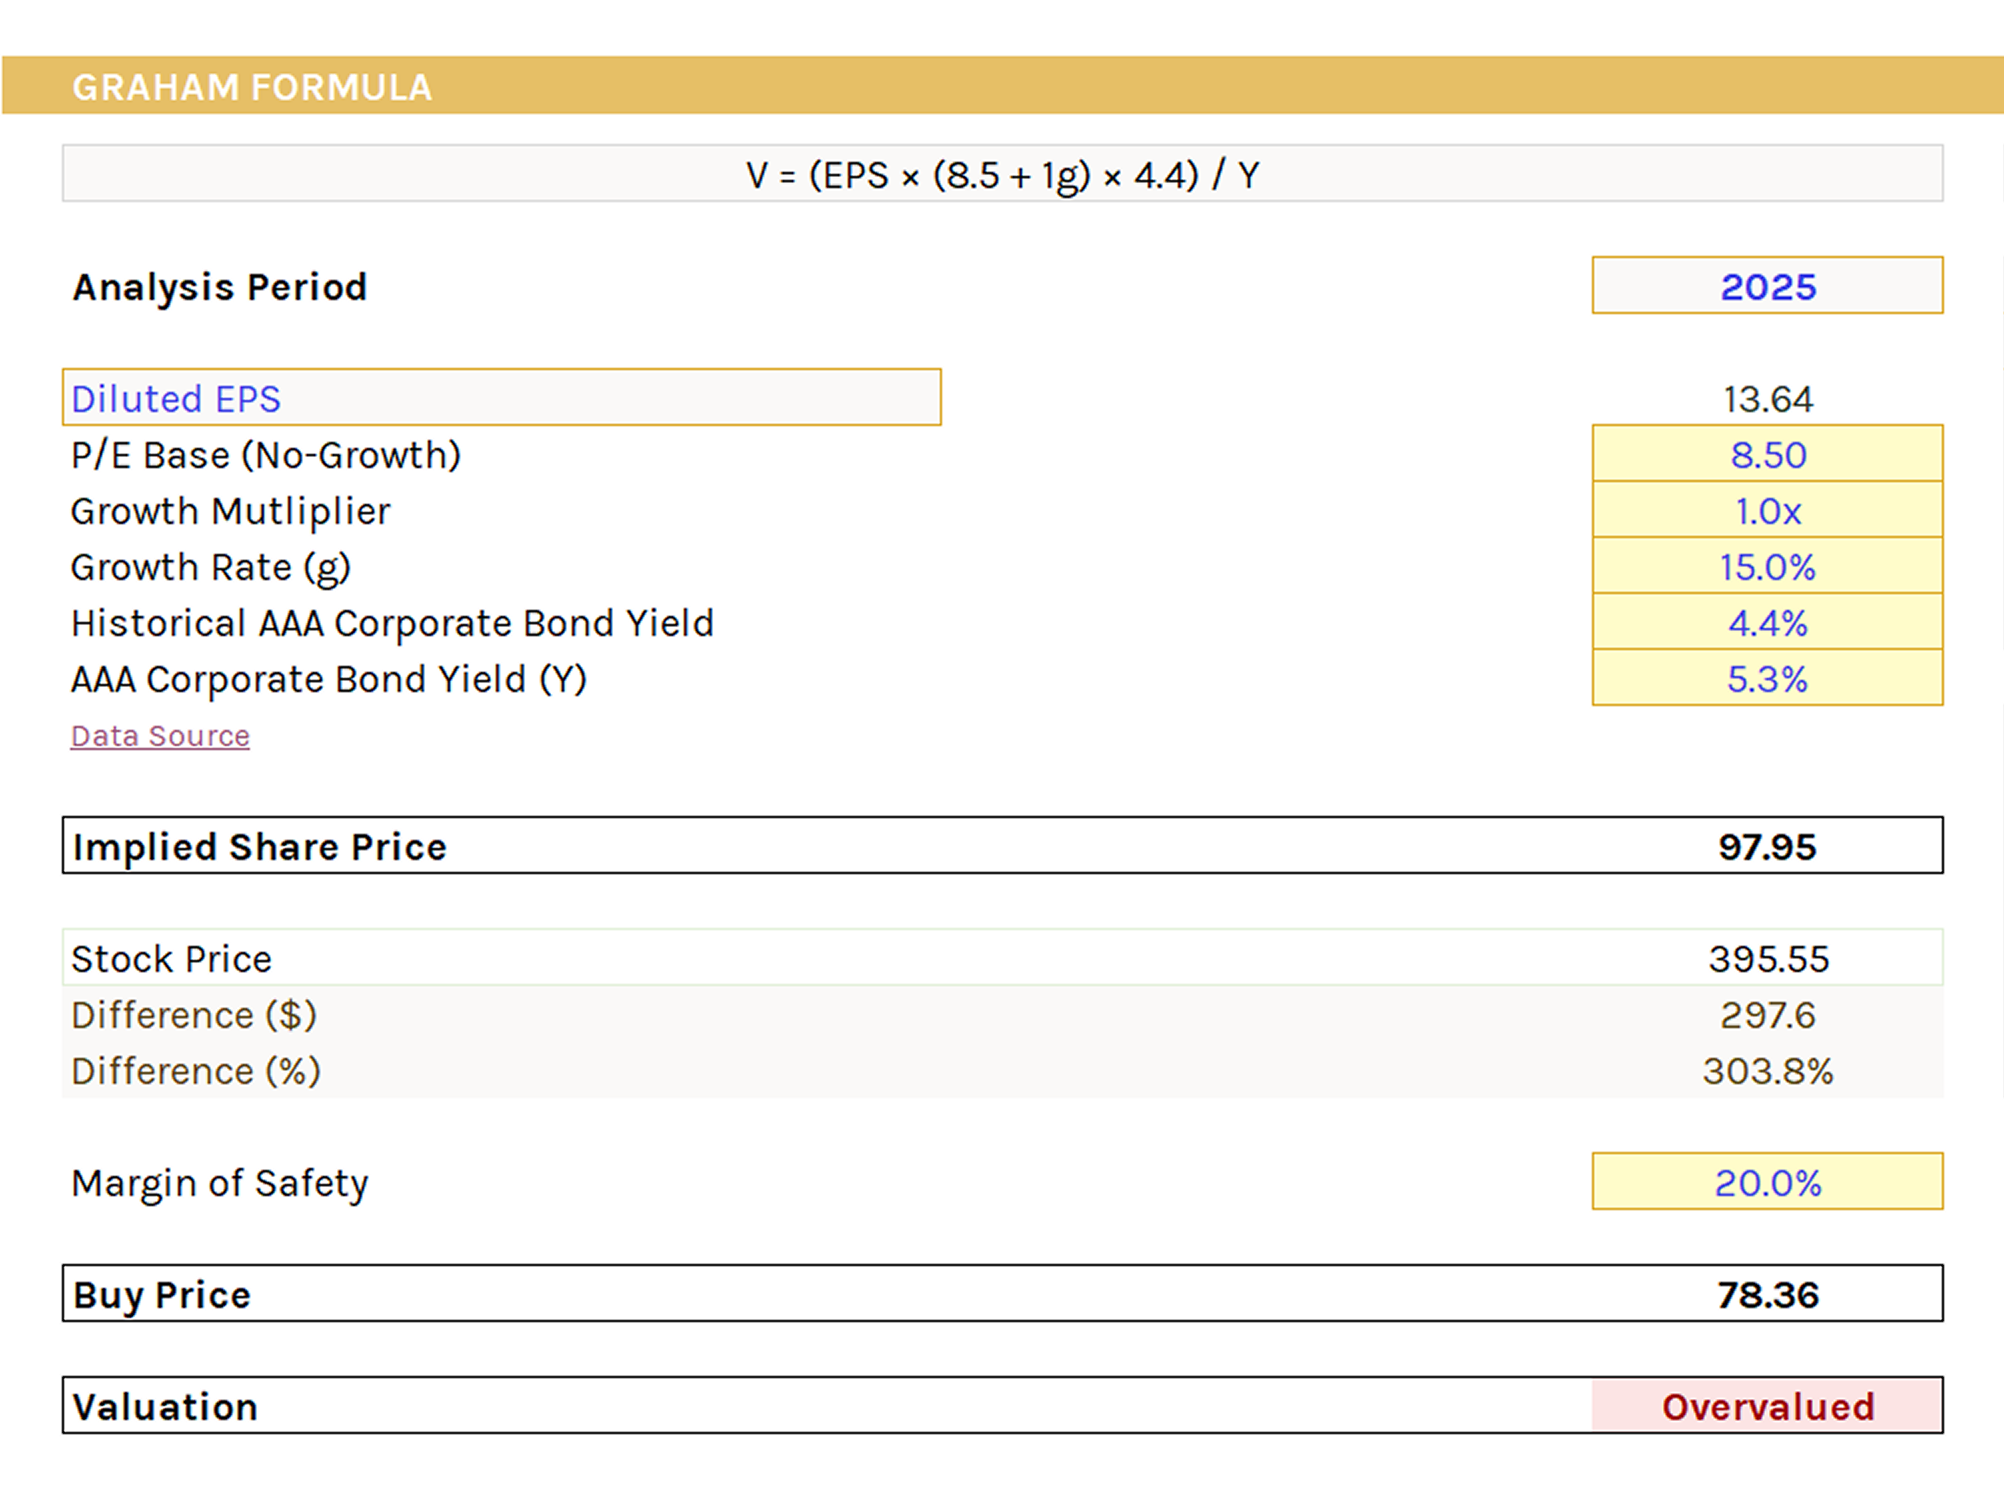
The model outputs an implied share price, compares it to the current stock price ($ and % difference), applies a user-defined margin of safety, and outputs a buy price with an overvalued/undervalued label.
Sensitivity Table: AAA Corporate Bond Yield vs. Growth Rate
Two-variable data table comparing AAA corporate bond yield against growth rate. Shows implied share prices across different combinations.
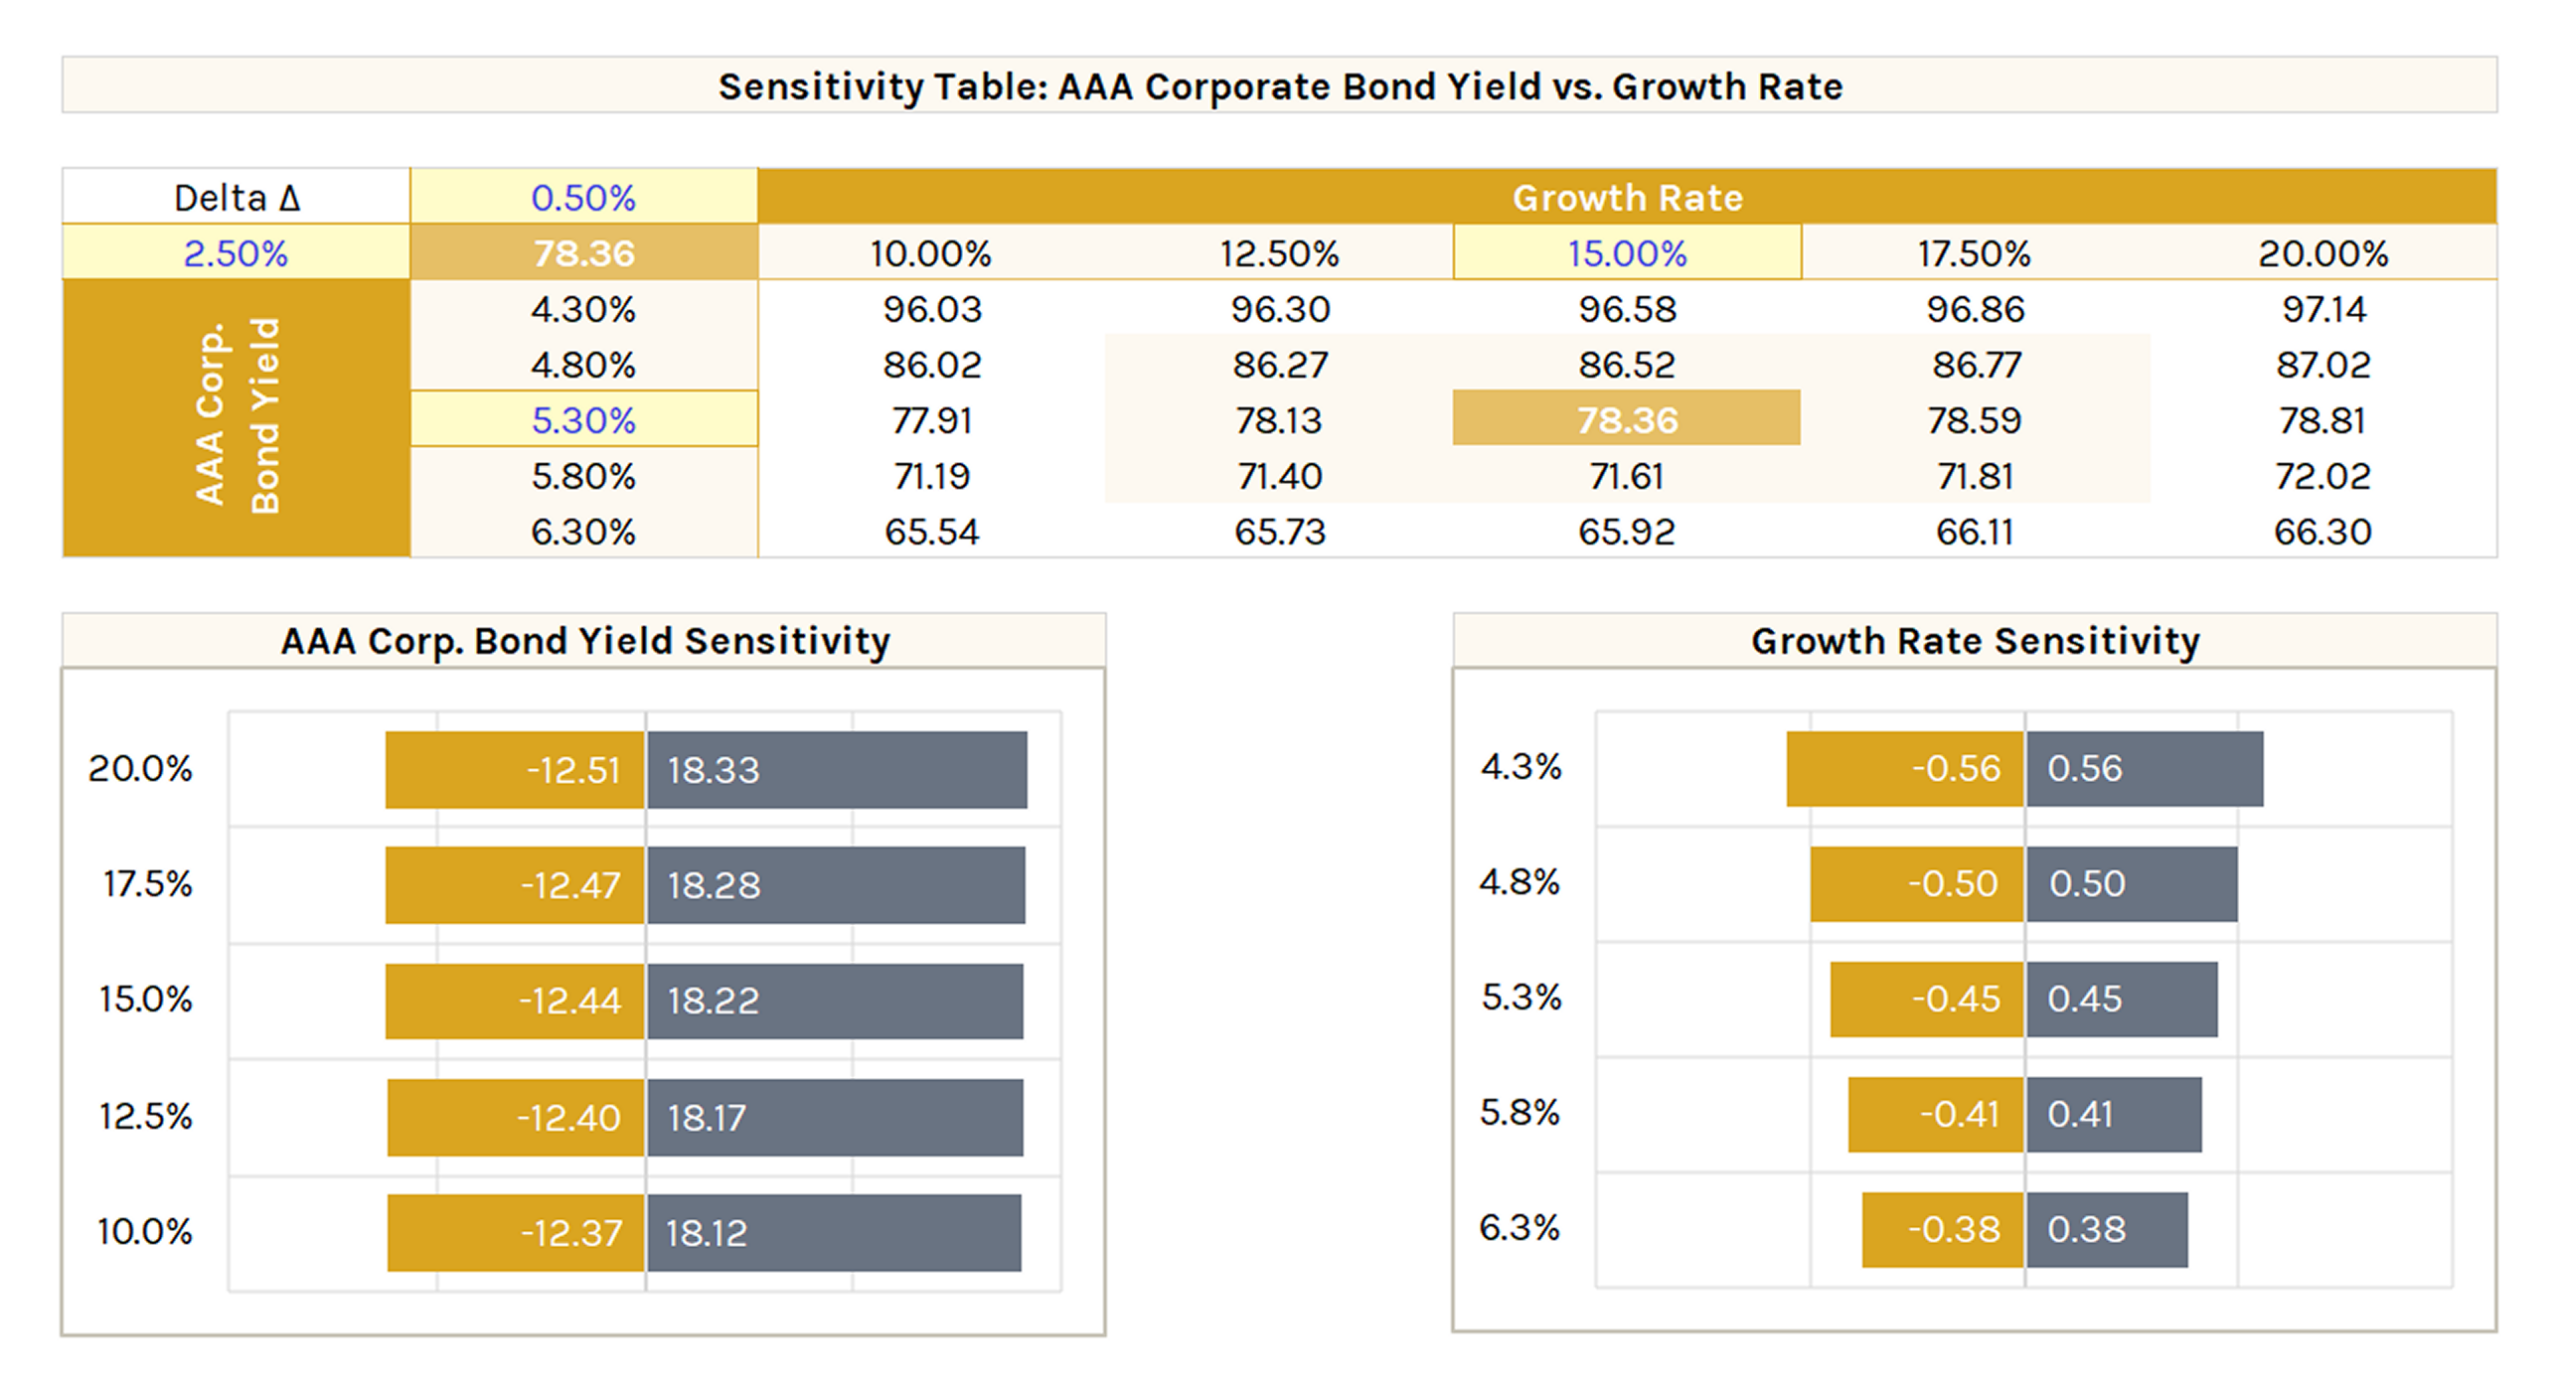
Two waterfall charts sit below the sensitivity table. Each isolates the impact of changing one variable while holding the other constant:
- Left chart shows how implied price changes as AAA corporate bond yield moves up or down from the base case (in equal increments set by the Delta input).
- Right chart does the same for the growth rate.
Bars to the right of center = higher implied price, bars to the left = lower. Useful for quickly seeing which variable has more impact on the valuation and by how much.