

Table of Contents
Dedicated charting tab with 36 pre-built charts and 14 custom chart slots. Key functionality:
- Checkbox at the top to show/hide data tables.
- Tables control what's displayed on each chart. Checkboxes on the left show/hide any line item, updating the chart, legend, and title dynamically.
- Some charts include additional dropdown/input options just above the respective chart.
Financial Statements
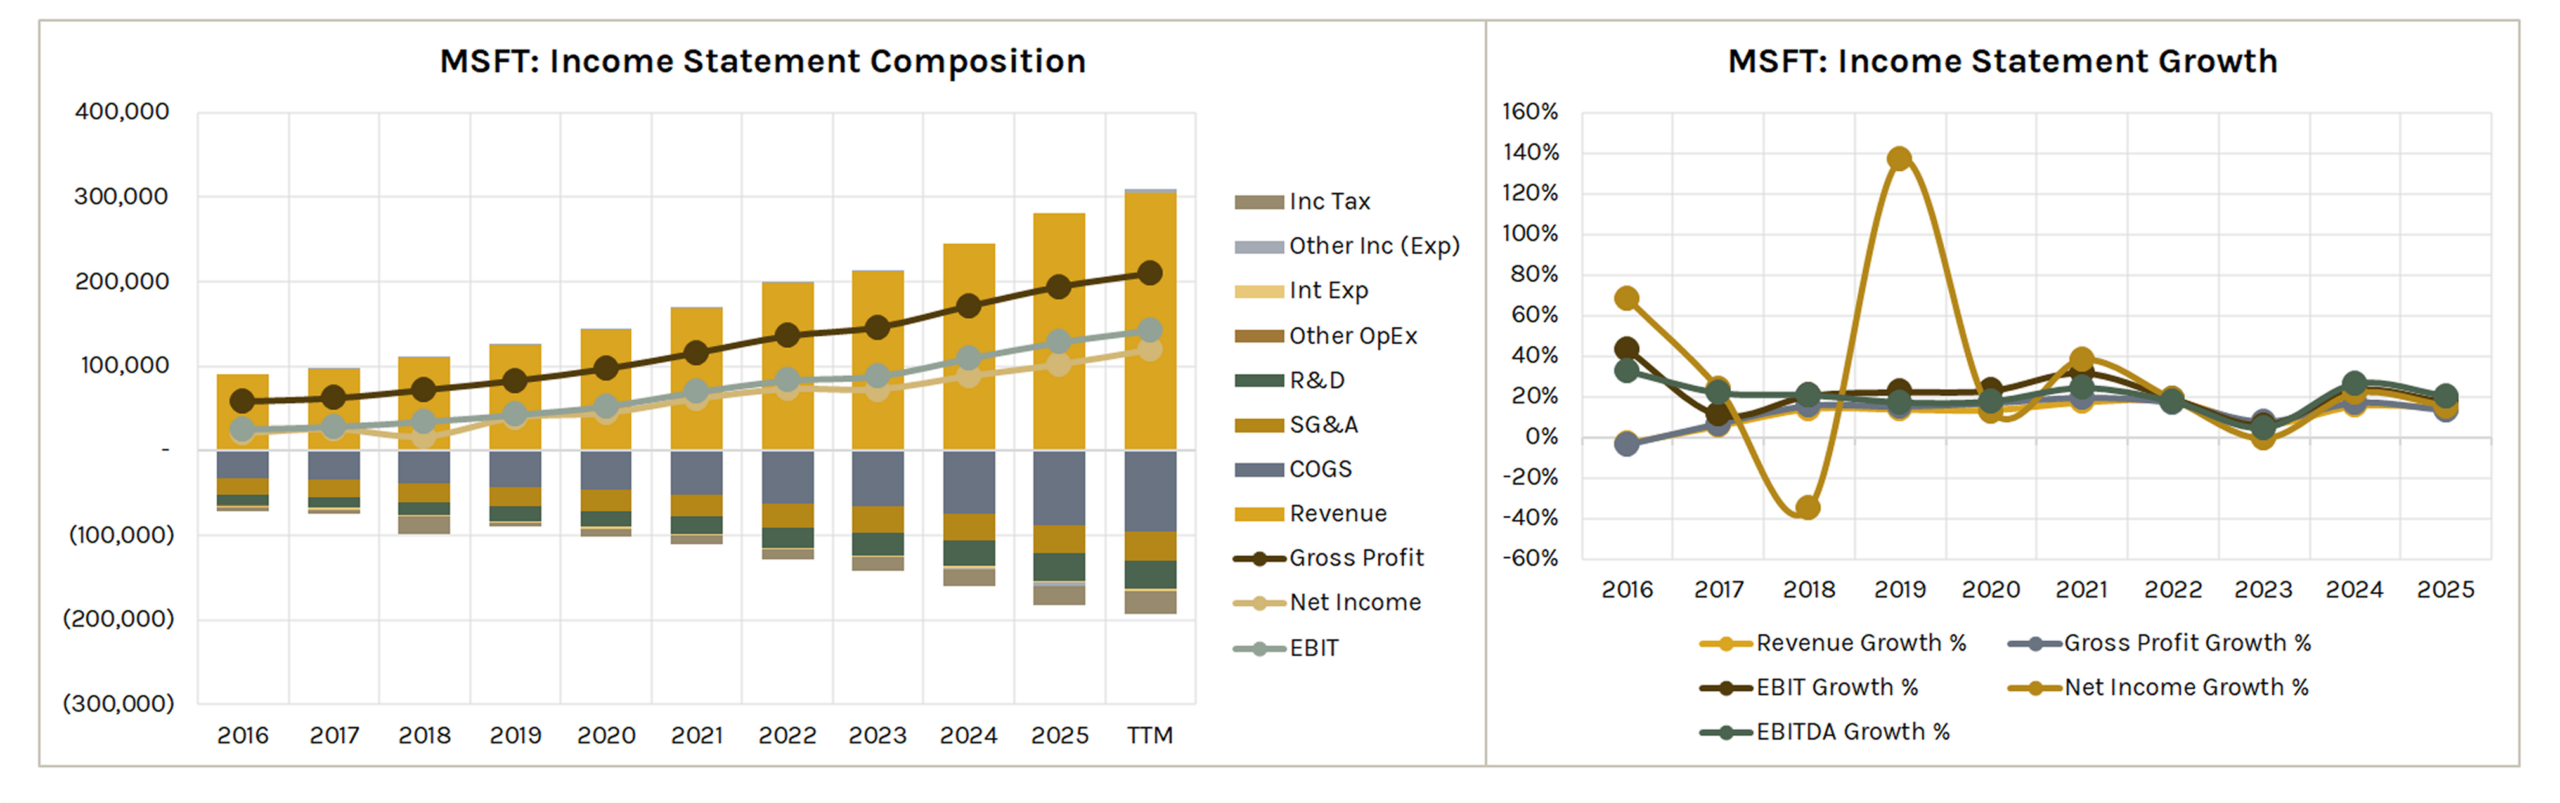
Income Statement Composition
Stacked bar and line chart showing revenue, costs (COGS, SG&A, R&D, Other OpEx, Interest Expense, Income Tax, Other Income/Expense), and profitability lines (Gross Profit, EBIT, EBITDA, Net Income) over time.
Useful for seeing where the company incurs expenses relative to revenue and how profitability trends.
Note: Expense items are displayed as negative values to illustrate their impact on profitability and may differ in sign from as-reported financials. D&A is not plotted on Income Statement Composition chart.
Income Statement Growth
Five line charts showing Y/Y growth rates for Revenue, Gross Profit, EBITDA, EBIT, and Net Income.
Balance Sheet Composition
Stacked bar chart showing either Assets or Liabilities & Equity over time (selectable via dropdown).
Two treemap charts display the composition of total assets and total liabilities & SE for a selectable period.
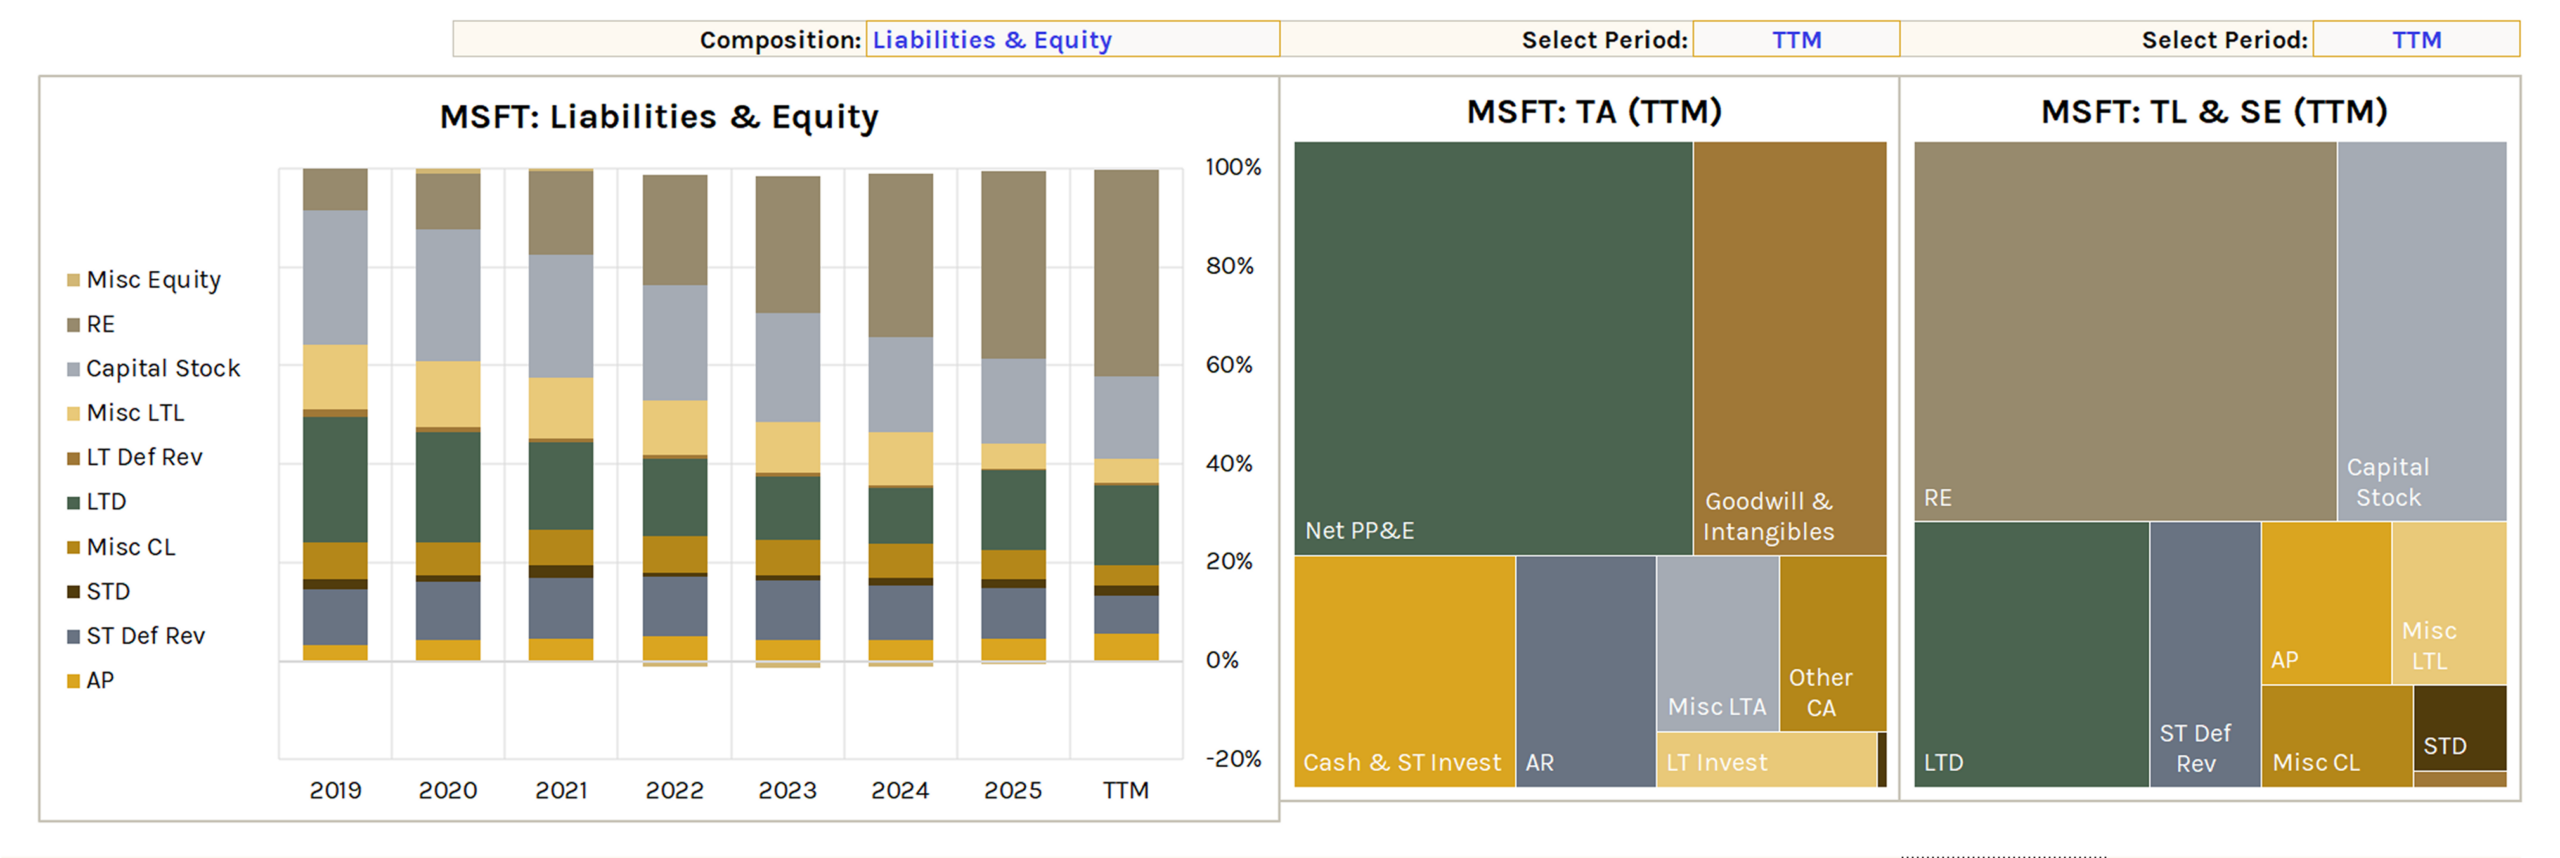
Note #1: Misc LTA = Def Tax Assets + Other LTA + Other Assets. Assets composition chart may have two "N/A" labels due to Excel limitations (it doesn't affect the visual analysis).
Note #2: Misc LTA = Def Tax Assets + Other LTA + Other Assets // Misc CL = Tax Pay + Other CL // Misc LTL = Def Tax Liab + Other LTL + Other Liab // Capital Stock = Comm Stock + Pref Stock // Misc Equity = AOCI + Min Int + Other Equity
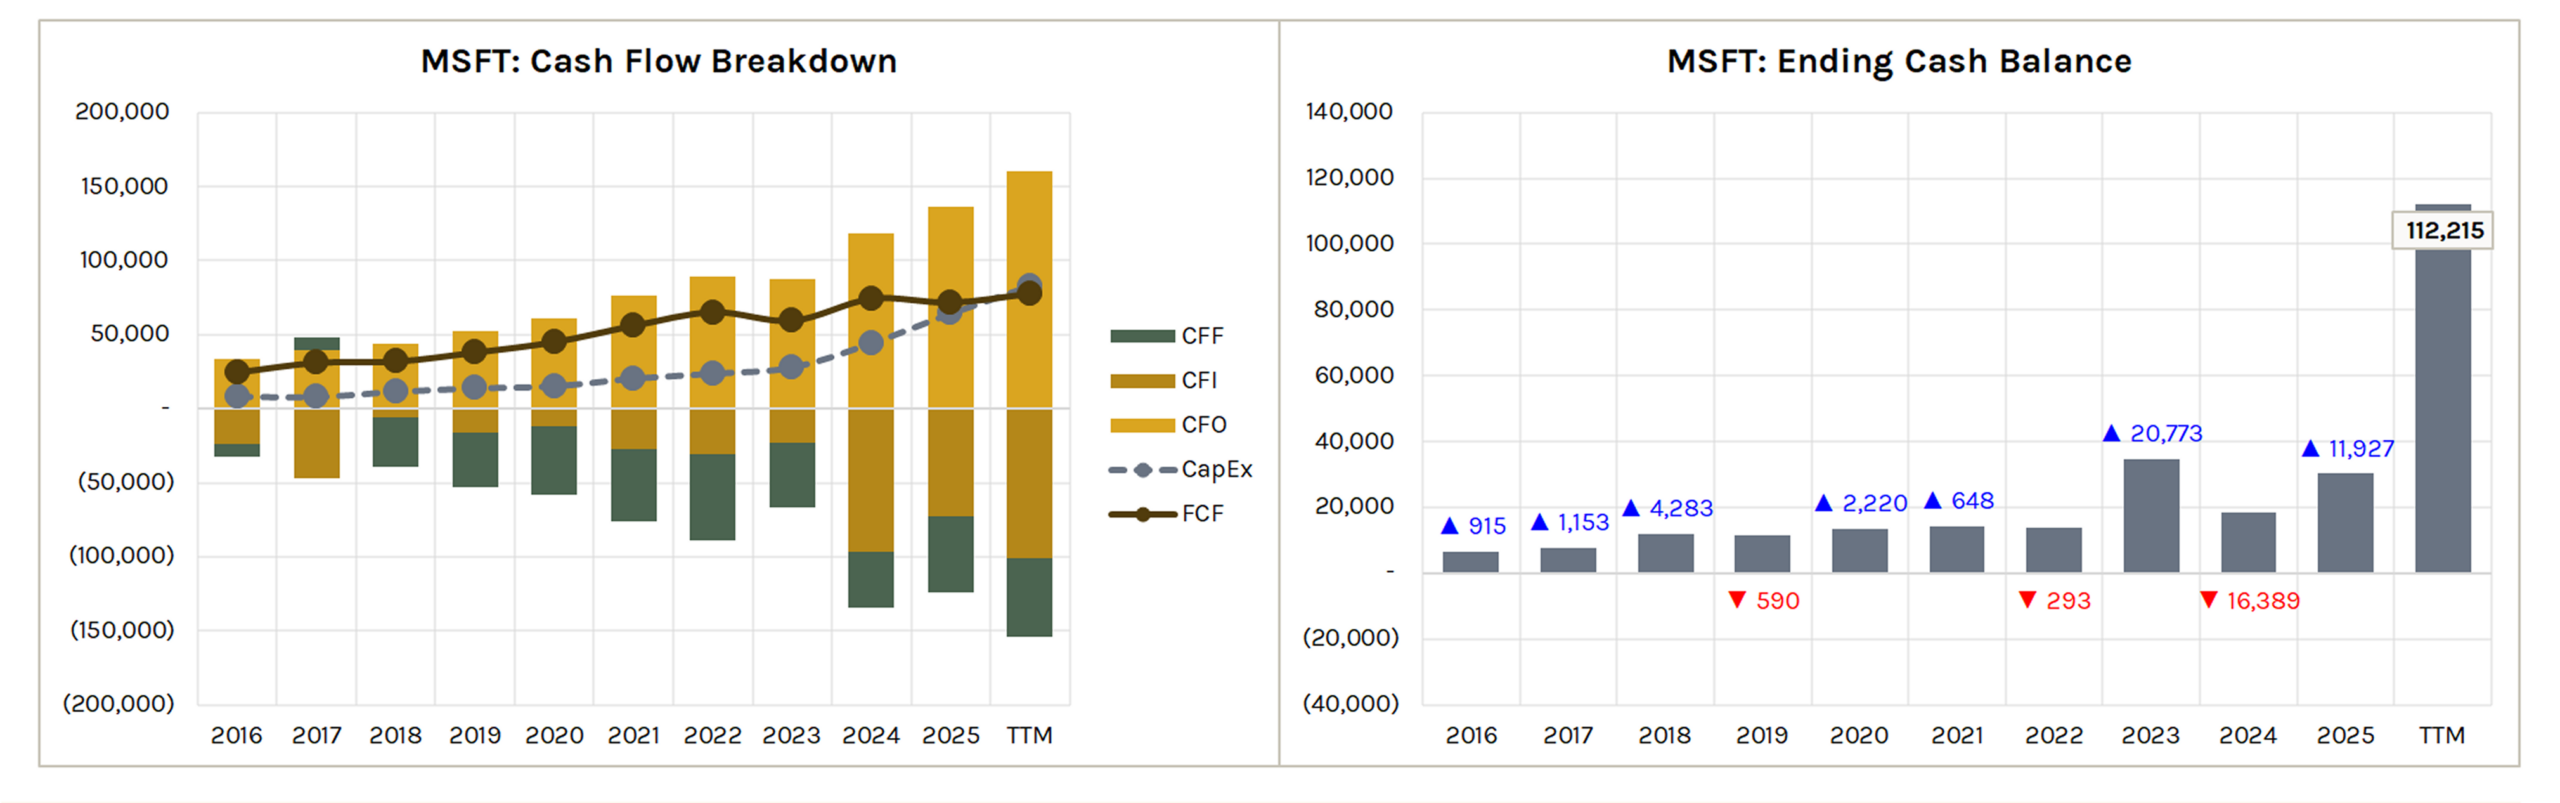
Cash Flow Breakdown
Stacked bar chart for CFO, CFI, and CFF with CapEx and FCF lines overlaid.
Shows operating, investing, and financing cash flow trends alongside free cash flow.
Ending Cash Balance
Bar chart showing the ending cash balance over time with net change in cash indicators (blue up arrow = increase, red down arrow = decrease).
Valuations
Historical Multiple & Fair Value
Left chart plots a selectable multiple (e.g., P/E) over time with a moving average line (selectable period).
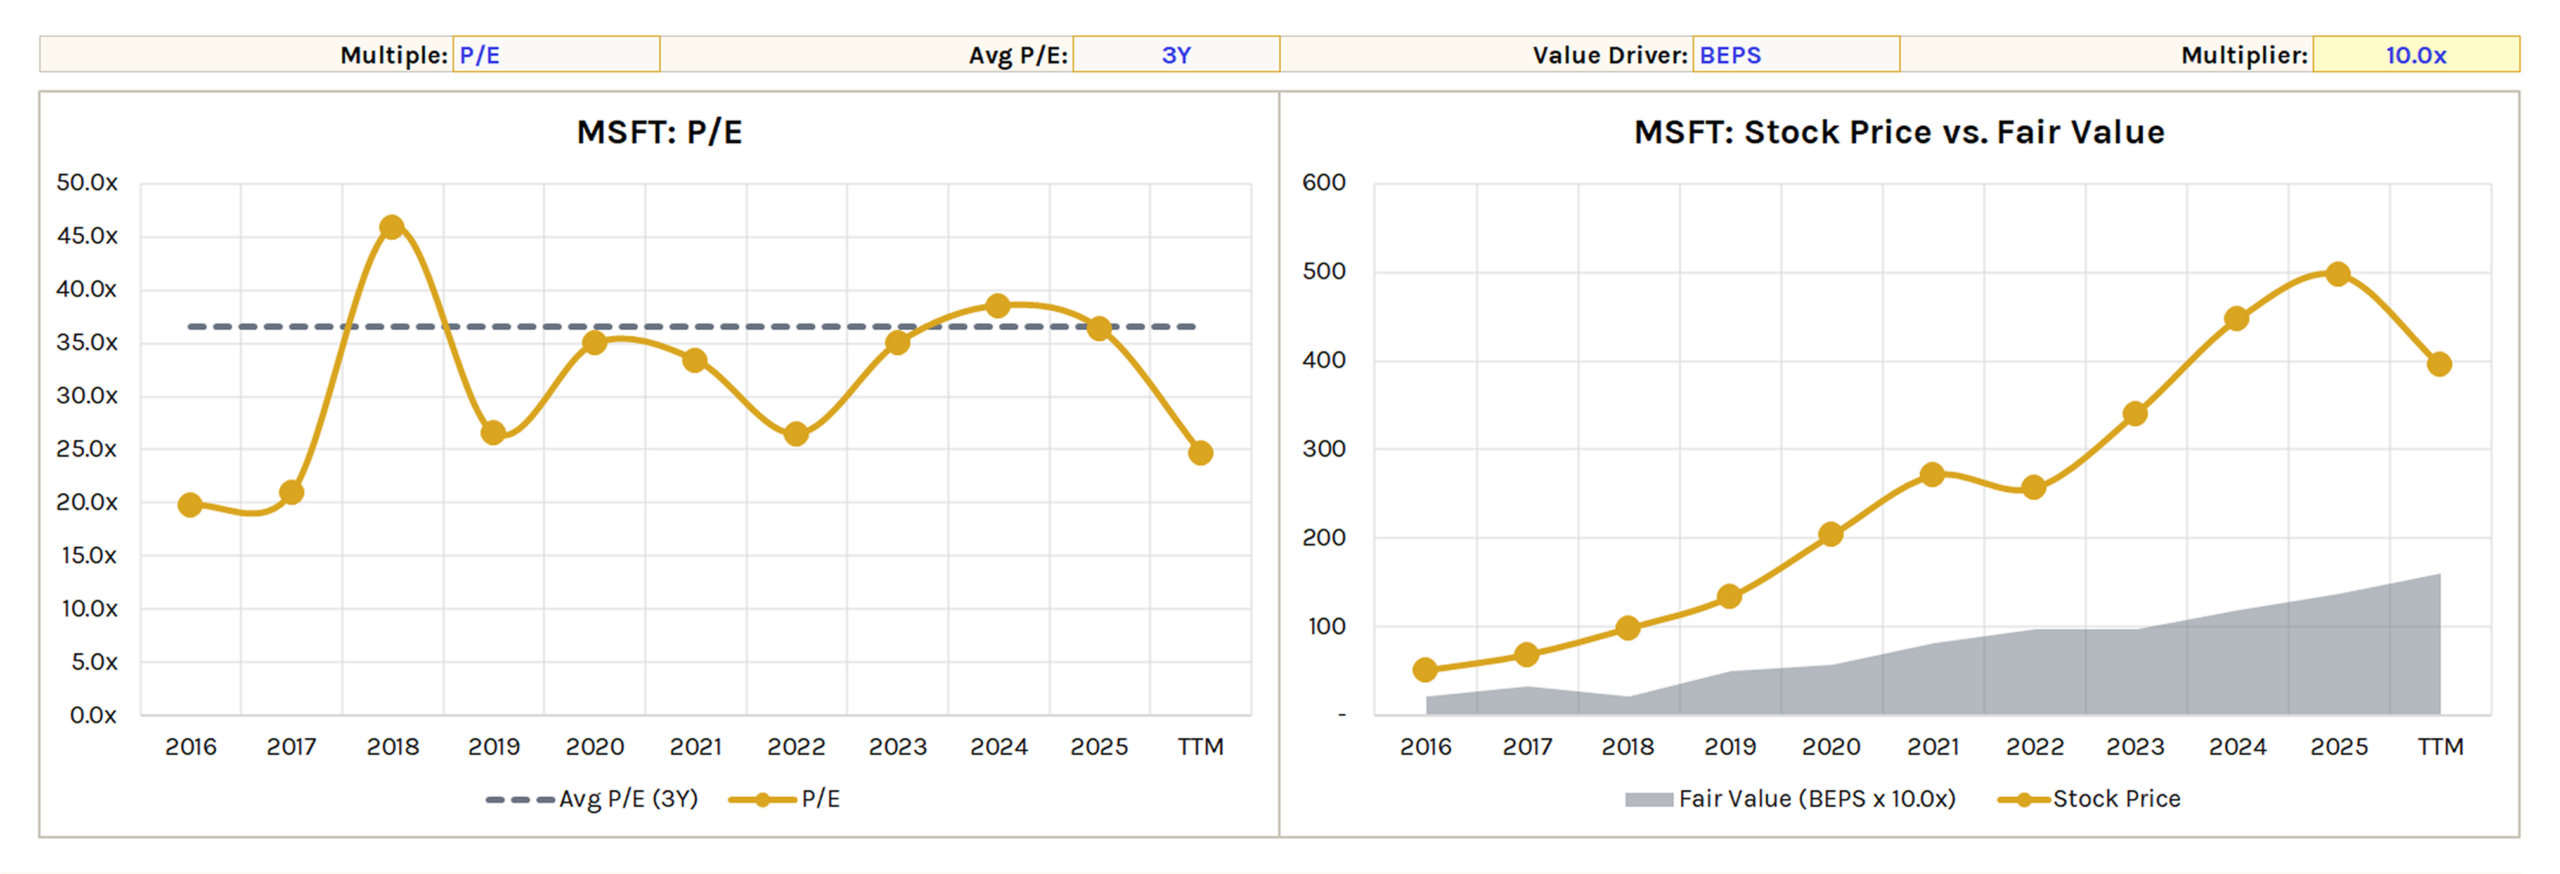
Right chart plots stock price vs. fair value estimate calculated as a selectable value driver (e.g., BEPS) × a user-defined multiplier.
Useful for assessing whether the stock is trading above or below a simple multiples-based fair value.
FCFF Bridge
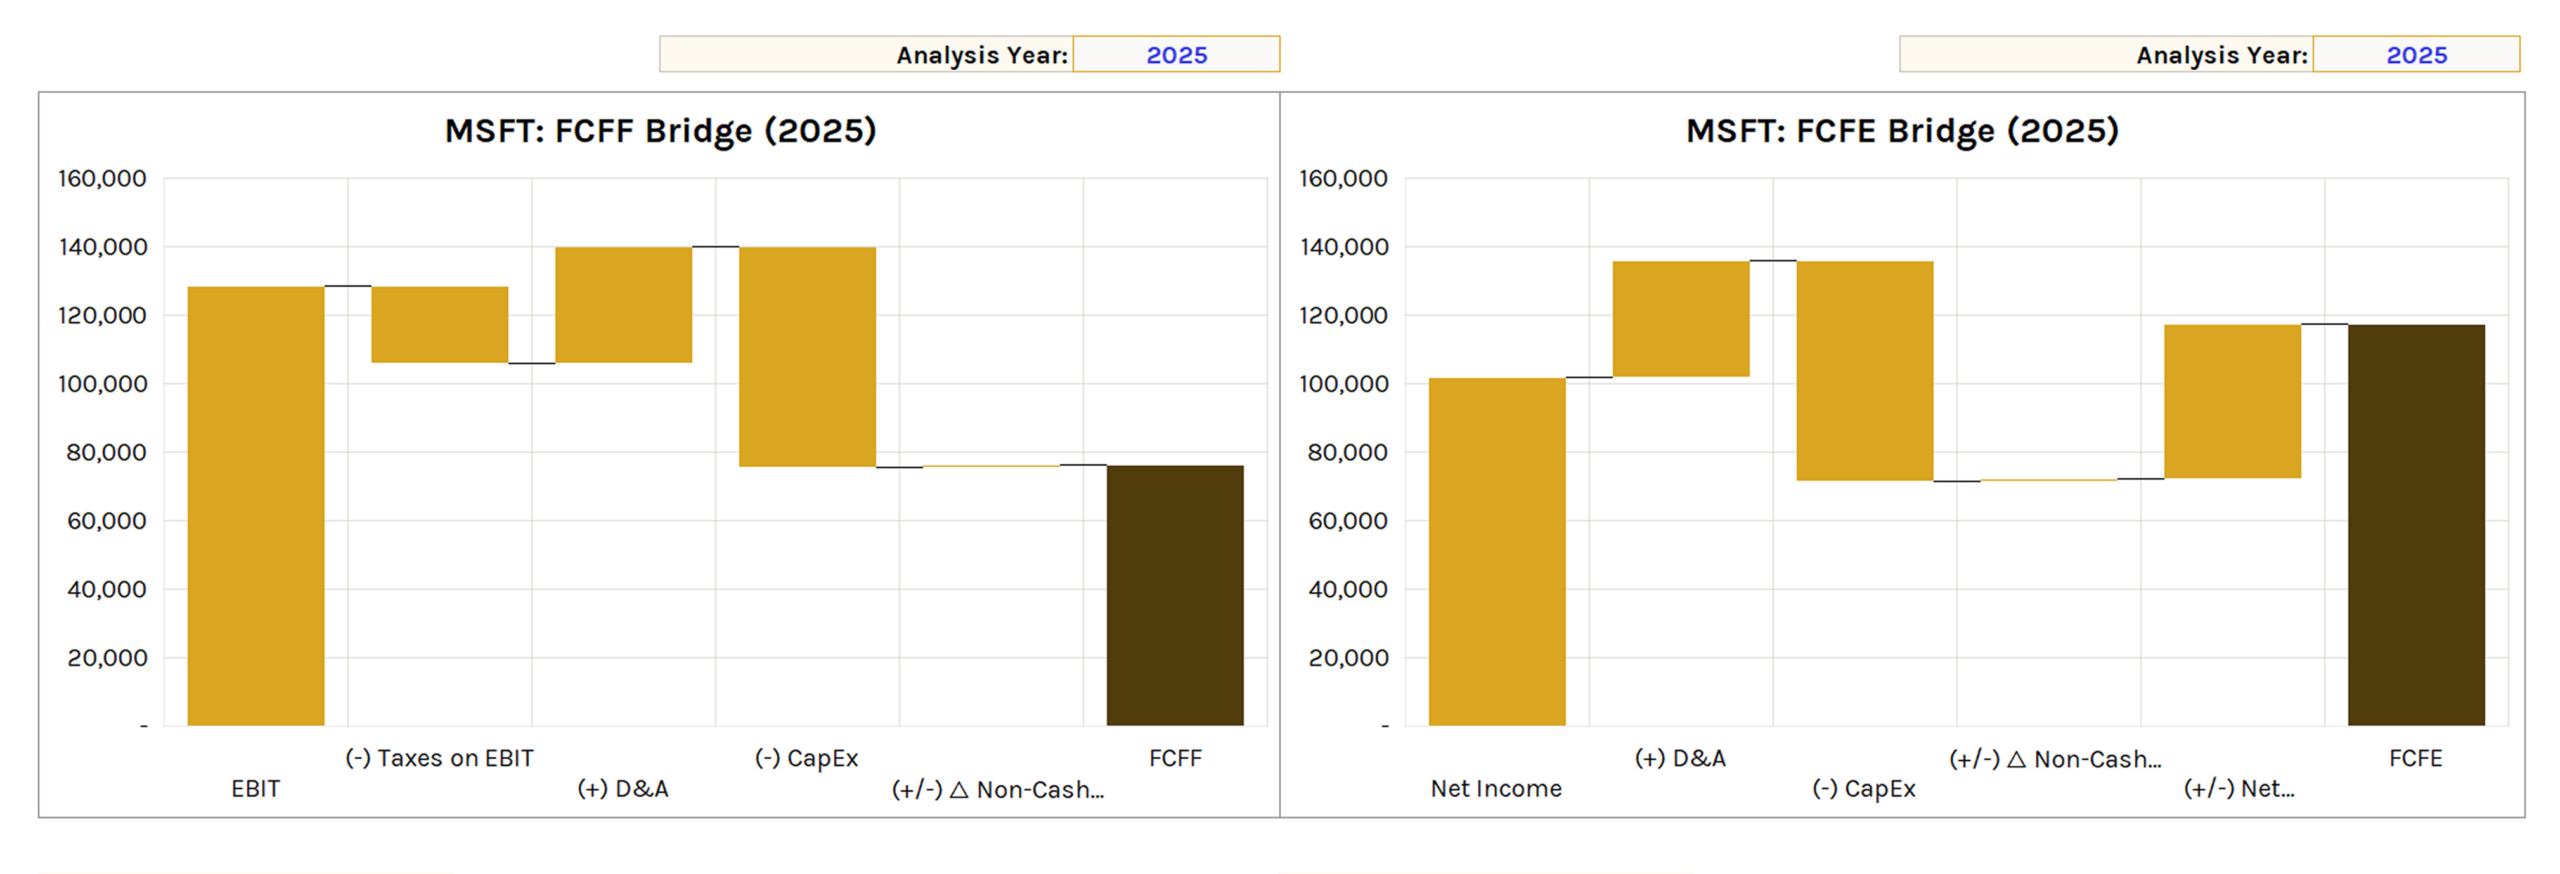
Waterfall chart showing the FCFF buildup for a selectable Analysis Year.
EBIT → (-) Taxes on EBIT → (+) D&A → (-) CapEx → (+/-) Δ Non-Cash NWC → FCFF.
Note #1: CapEx is displayed as negative to illustrate its impact on FCFF/FCFE and may differ in sign from as-reported financials.
FCFE Bridge
Waterfall chart showing the FCFE buildup for a selectable Analysis Year.
Net Income → (+) D&A → (-) CapEx → (+/-) Δ Non-Cash NWC → (+/-) Net Borrowing → FCFE.
Note #2: FCFE may differ slightly from FCFE calculated on KFS (calculated from FCFF).
Returns & Quality
Comparables Scatter Plots
Two scatter plots comparing the main ticker against comparables. Comps years and Analysis Year are selectable.
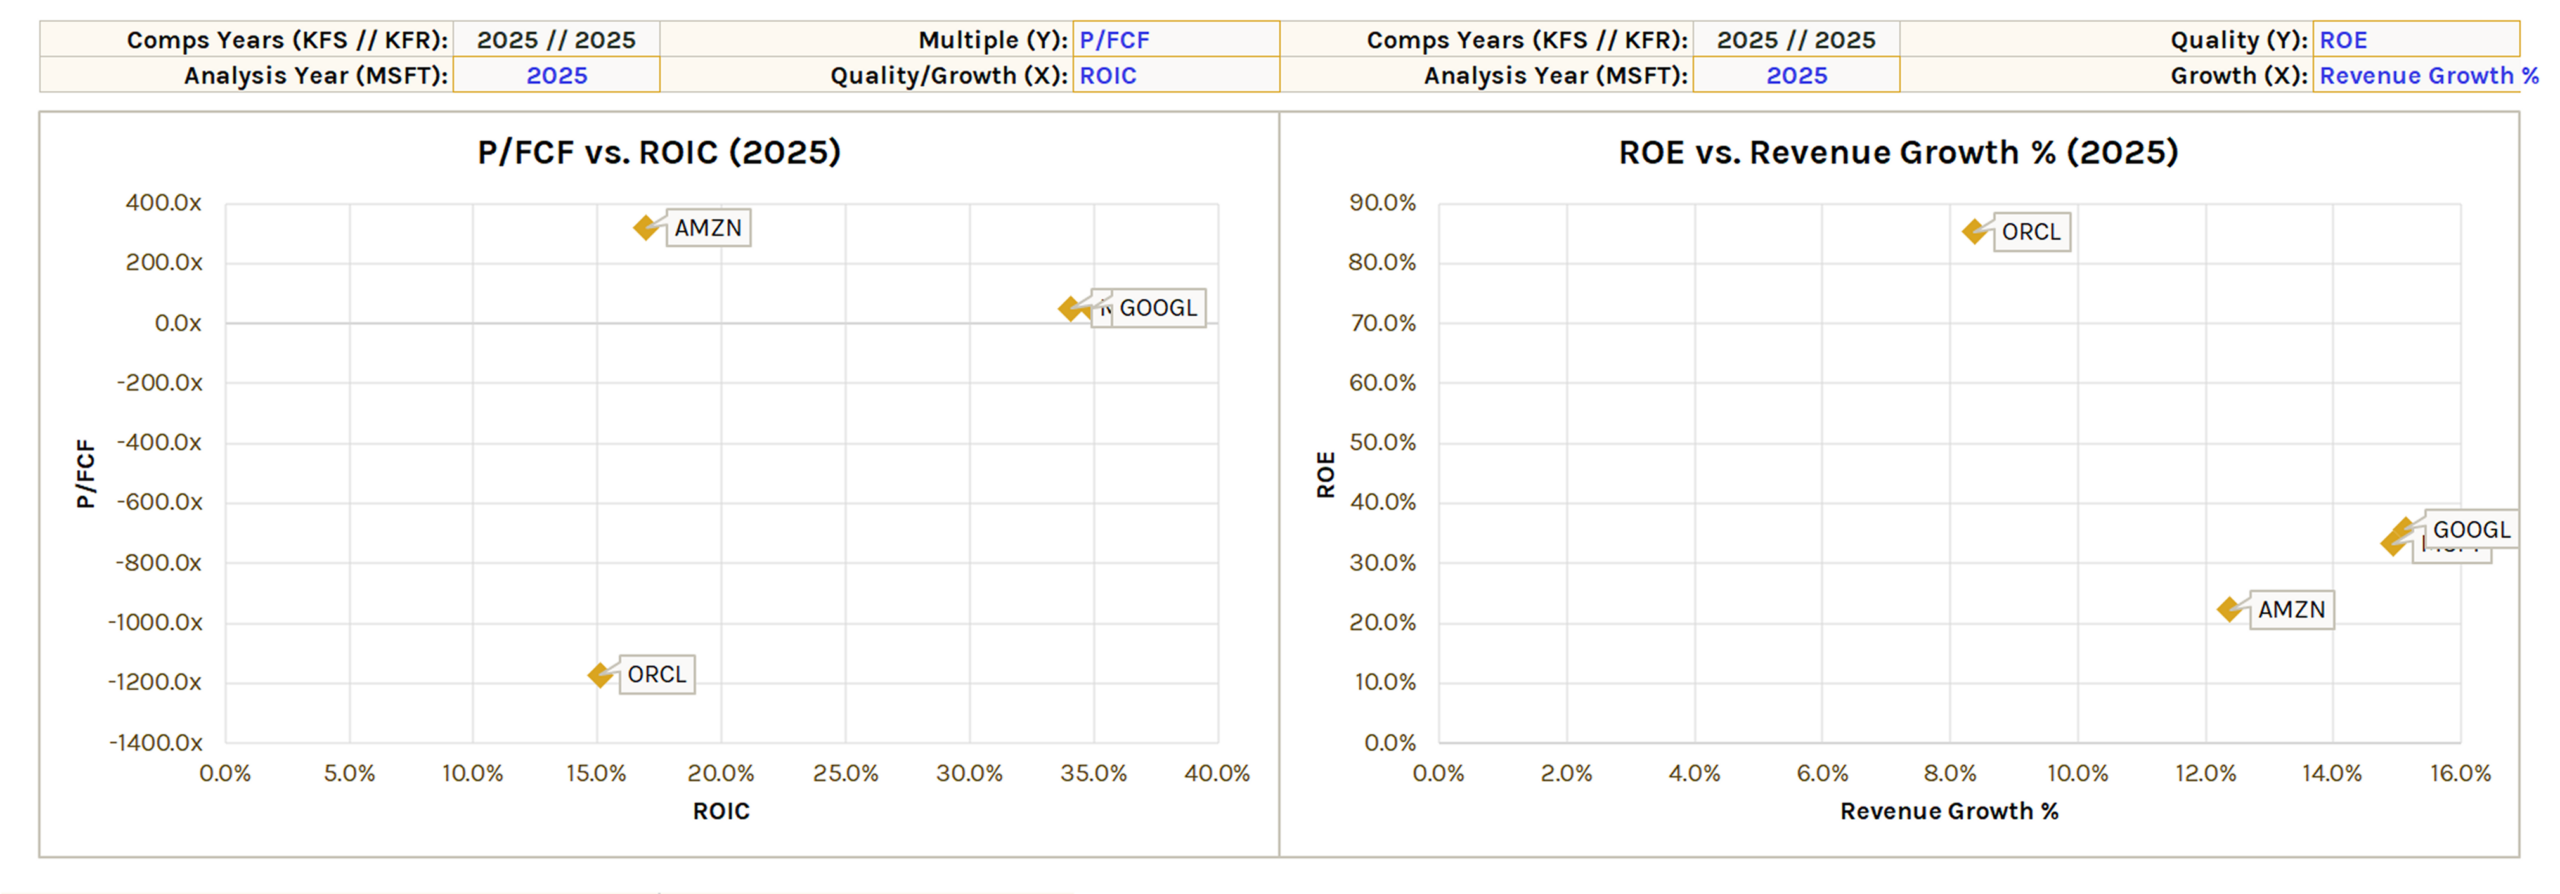
Left chart plots a selectable multiple (Y) vs. a quality/growth metric (X) (e.g., P/FCF vs. ROIC).
Right chart plots a quality metric (Y) vs. a growth metric (X) (e.g., ROE vs. Revenue Growth %).
Note: Comps years are pulled from the KFS and KFR tab selections. Set these to match the Analysis Year for an apples-to-apples comparison.
Returns on Capital vs. Hurdle Rate
Left chart plots a selectable return on capital metric (e.g., ROIC) and incremental return metric (e.g., ROIIC) against a user-defined hurdle rate.
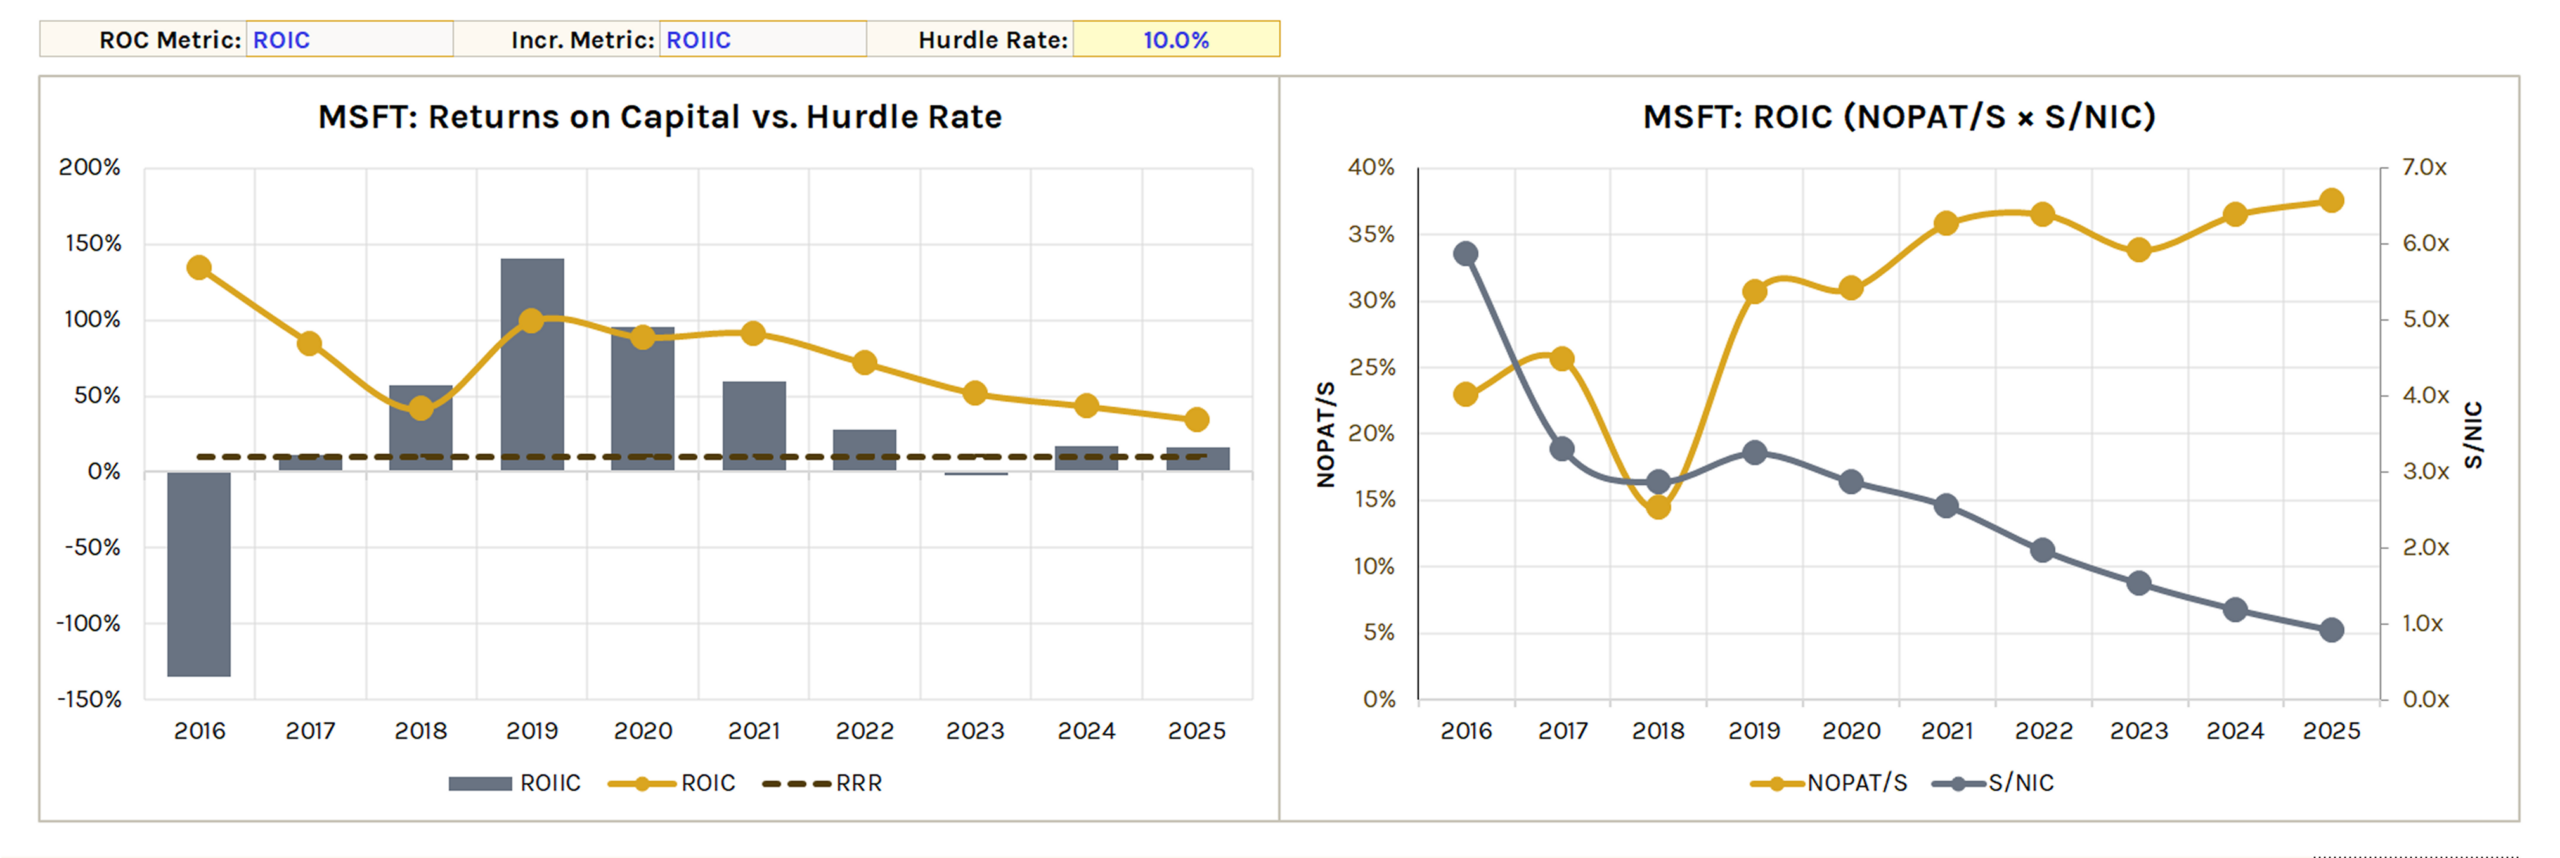
Right chart decomposes the selected ROC metric (e.g., ROIC = NOPAT/S × S/NIC) to show margin vs. capital efficiency drivers over time.
SBC Dilution vs. Share Repurchases
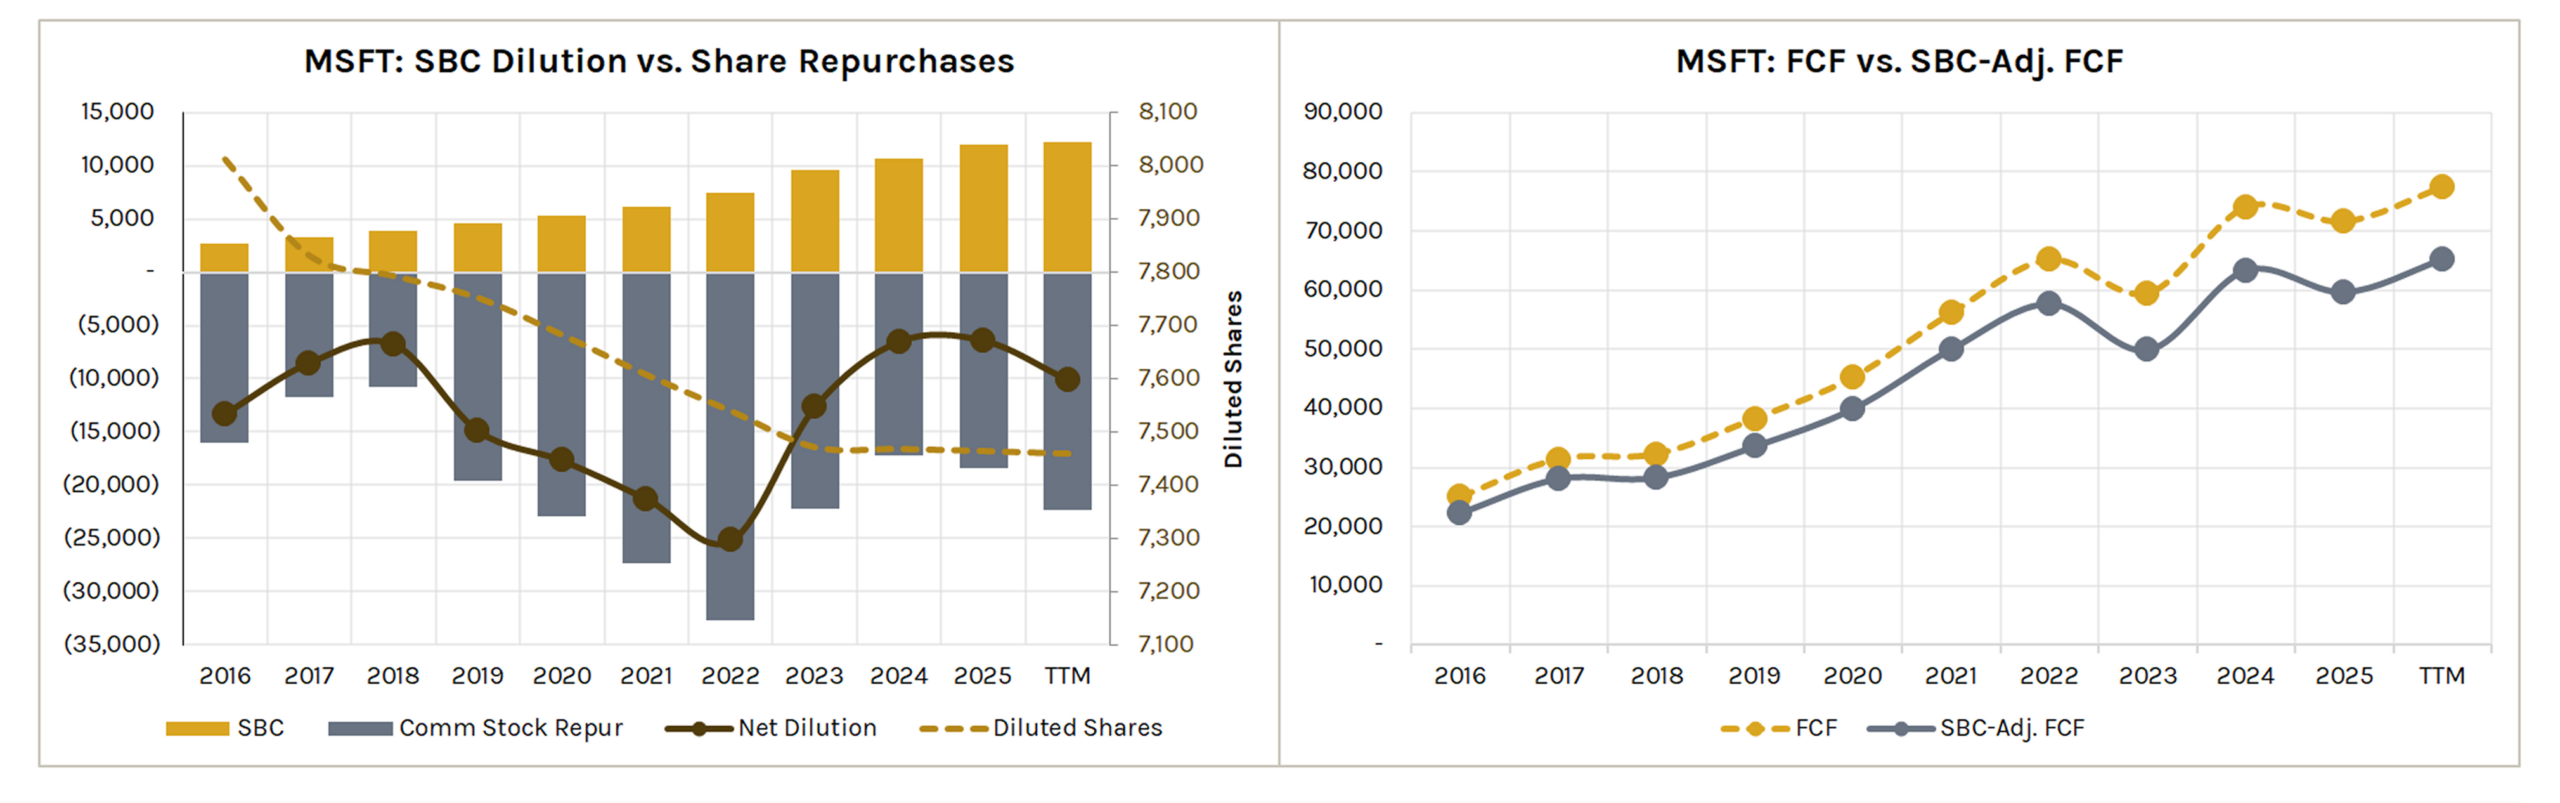
Shows SBC, common stock repurchases, net dilution, and diluted shares over time.
Useful for assessing whether buybacks are offsetting or exceeding stock-based compensation.
FCF vs. SBC-Adjusted FCF
Compares reported FCF to FCF adjusted for SBC.
Shows the true cash generation after accounting for dilution costs.
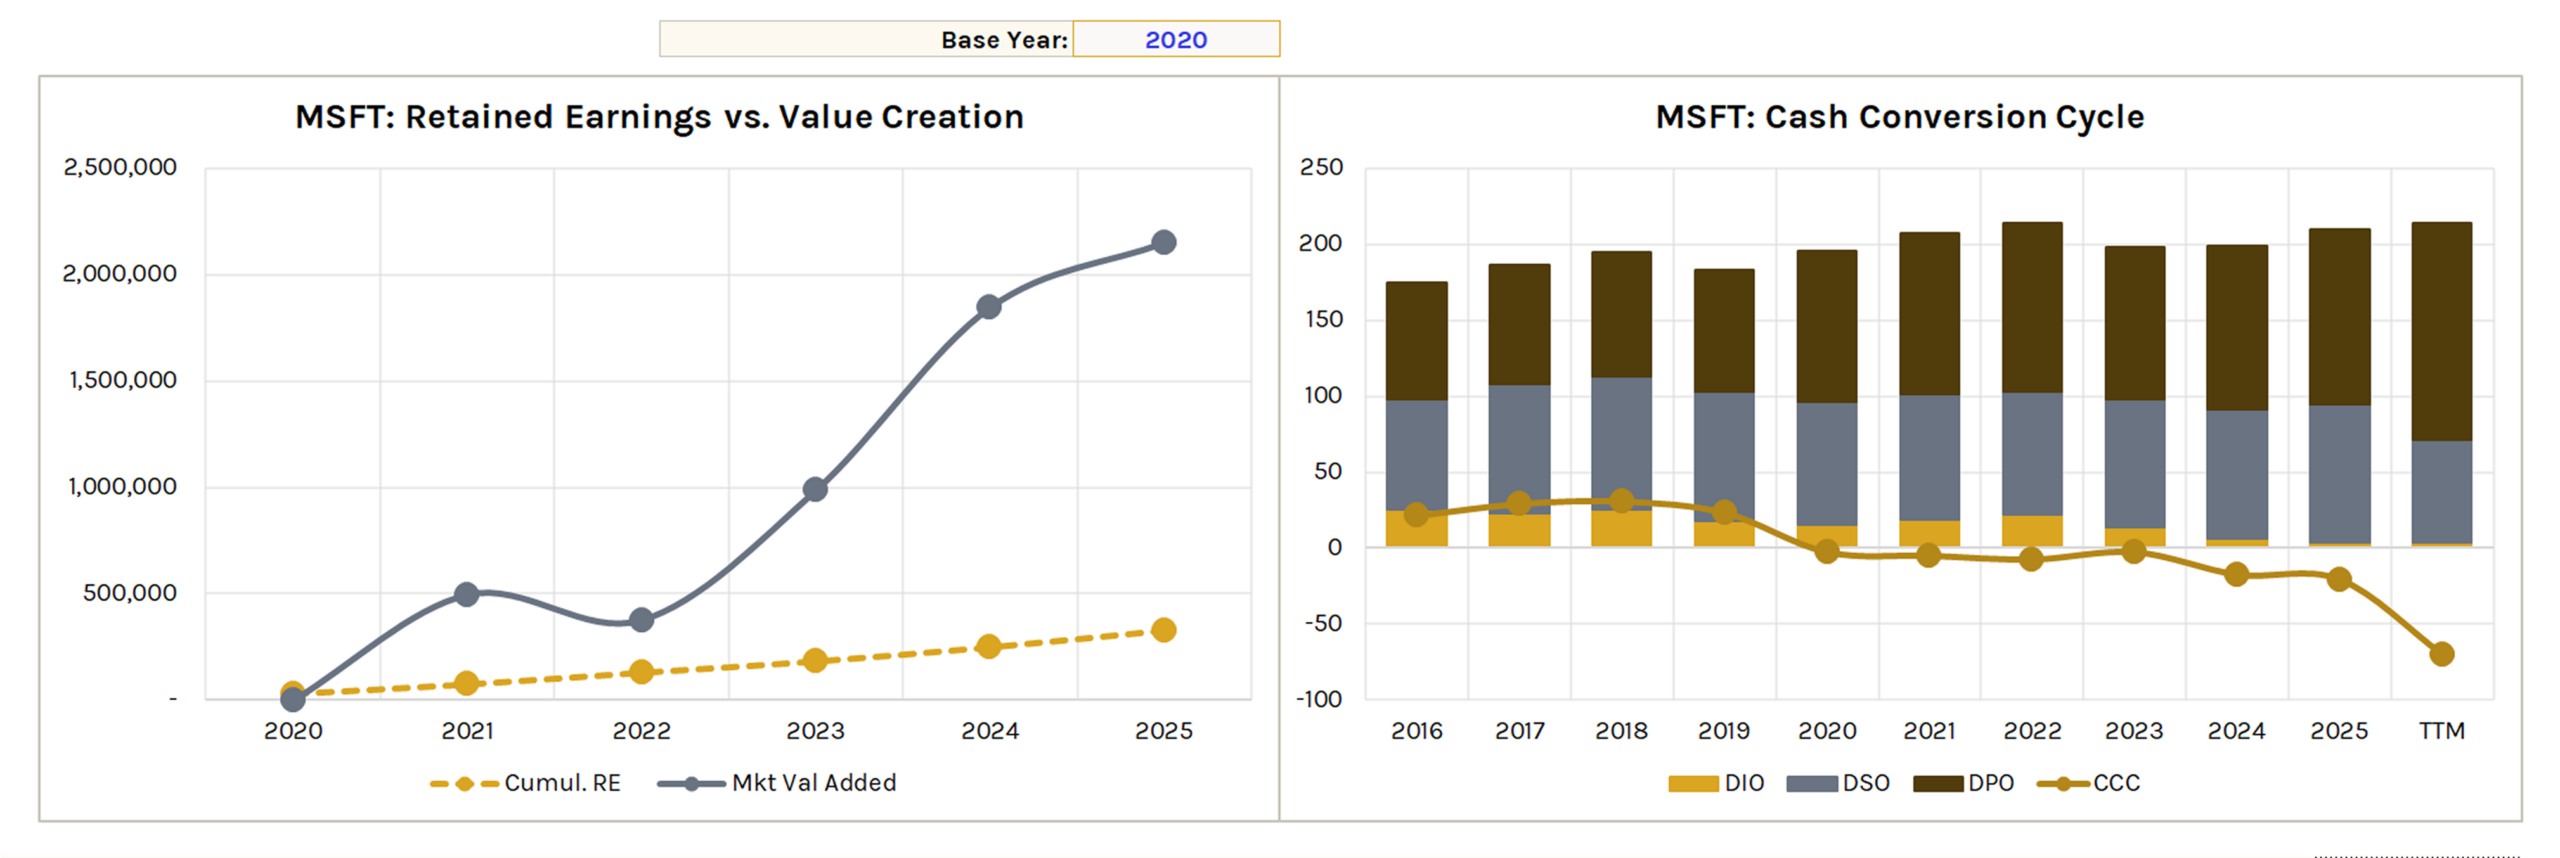
Retained Earnings vs. Value Creation
Plots cumulative retained earnings against market value added over a selectable base year period.
Useful for evaluating whether management is creating value in excess of what it retains.
Cash Conversion Cycle
Stacked bar chart for DIO, DSO, and DPO with a CCC line overlay. Tracks how efficiently the company converts inventory and receivables into cash.
Note: DPO is displayed as negative to illustrate its impact on CCC and may differ in sign from as-reported financials.
Capital Allocation
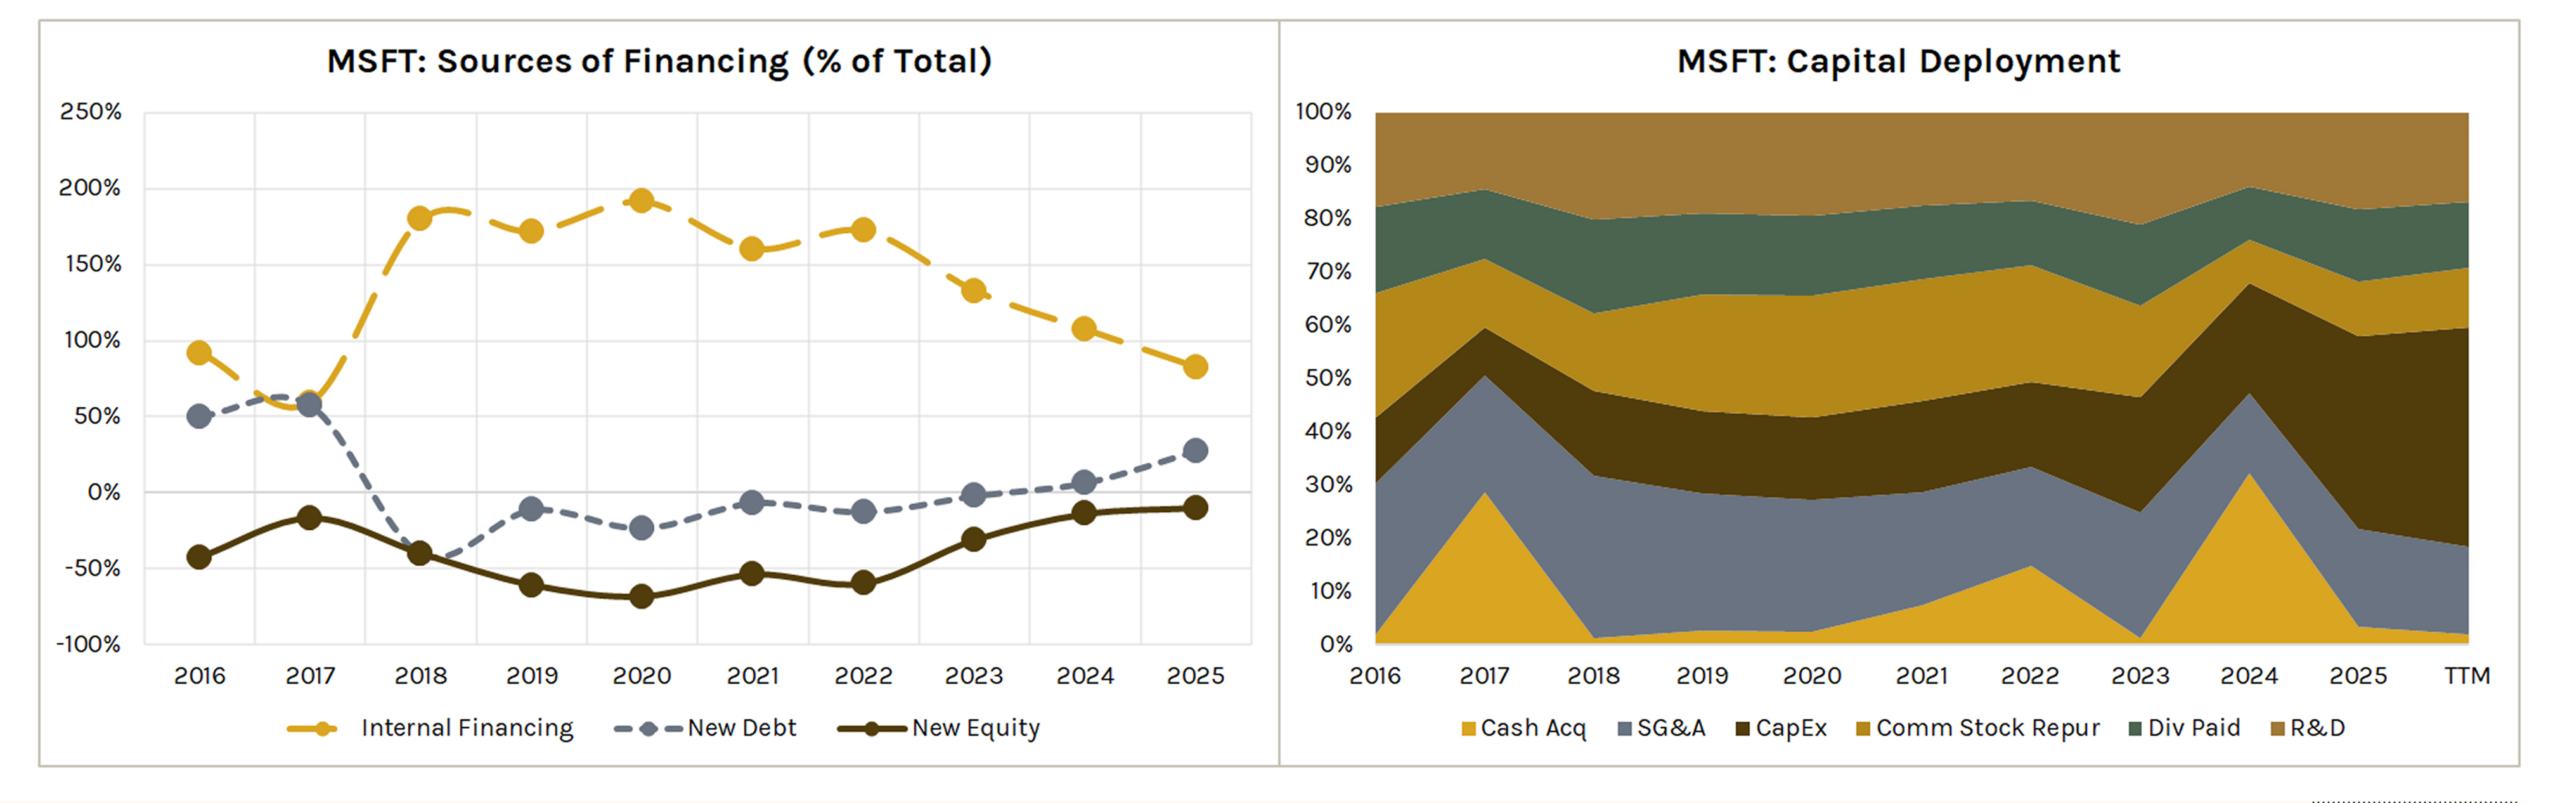
Sources of Financing (% of Total)
Line chart showing the proportion of total financing from internal financing (CFO), new debt (net borrowing), and new equity (net issuance common stock) over time.
Capital Deployment
100% stacked area chart showing how the company allocates capital across R&D, SG&A, CapEx, share repurchases, dividends, and cash acquisitions.
Note: Capital deployment values are absolute to enable proportional comparison in the 100% stacked area chart.
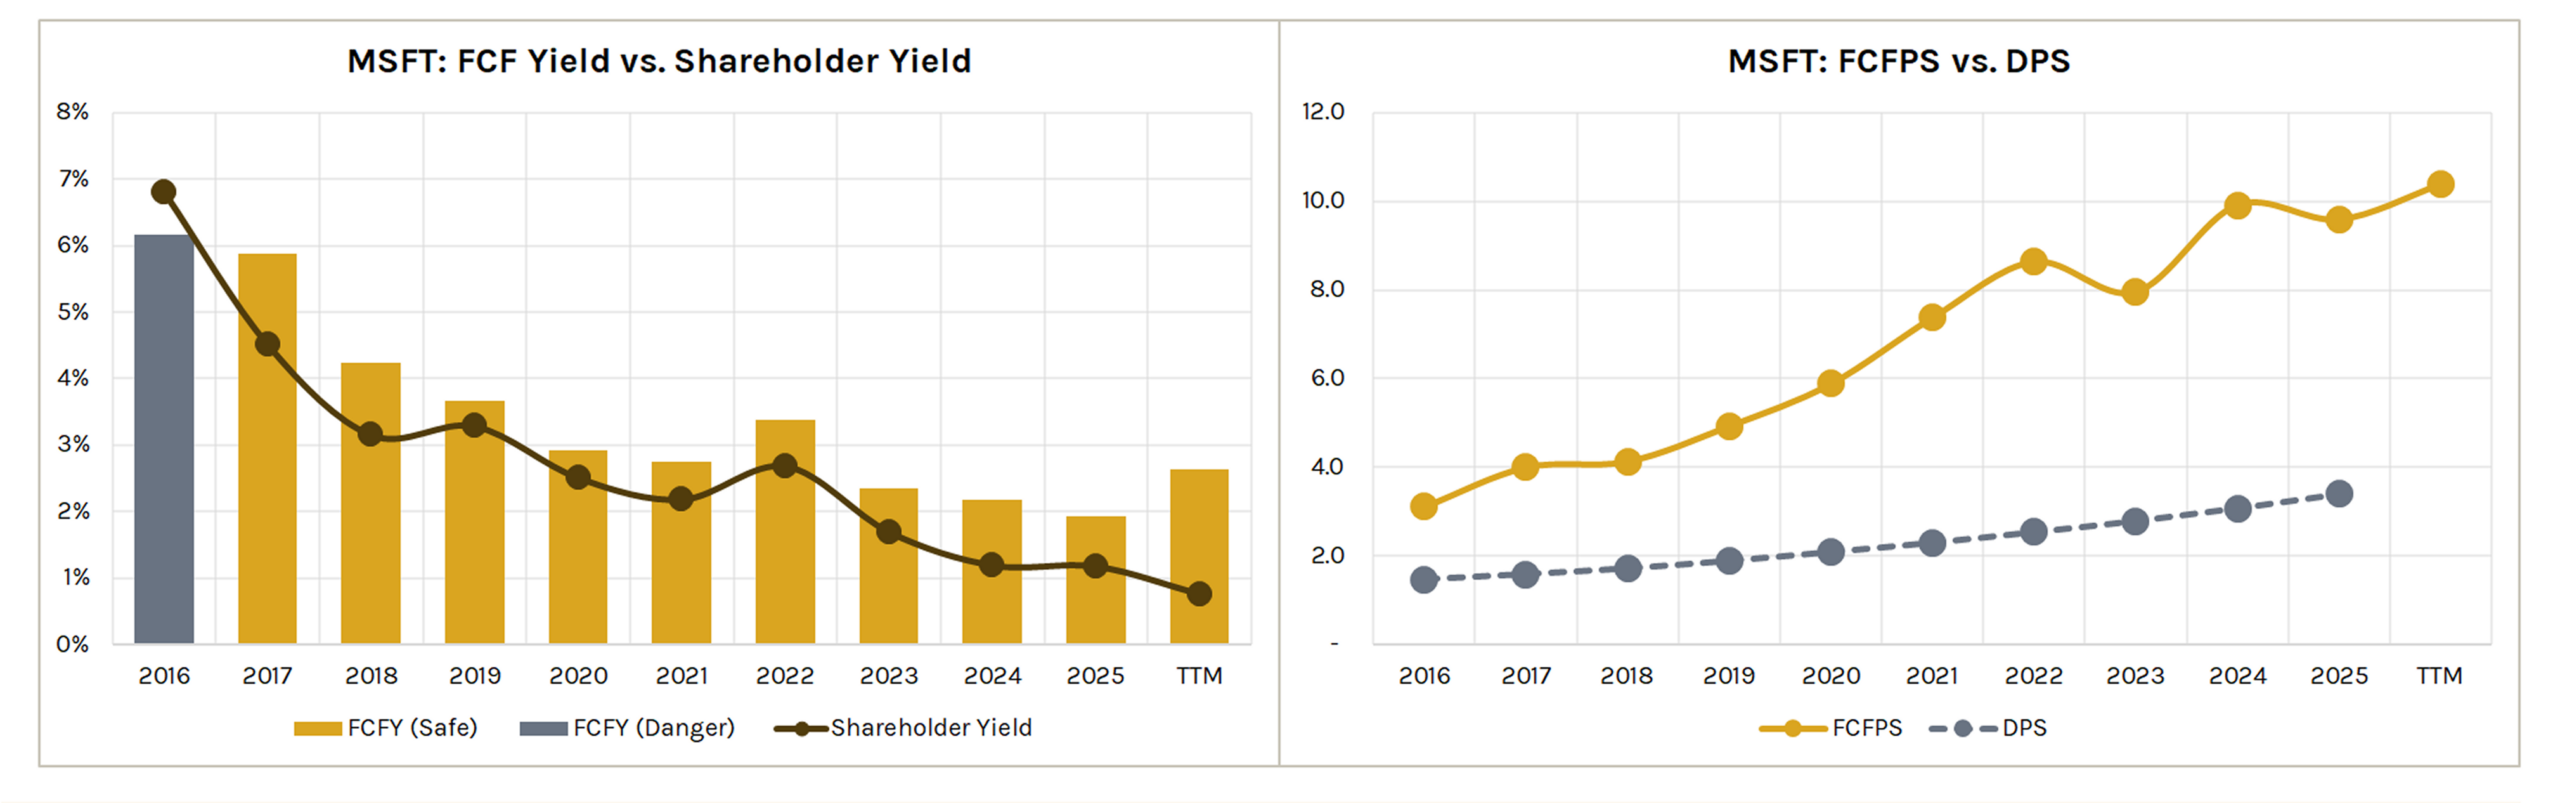
FCF Yield vs. Shareholder Yield
FCF yield (split into safe/danger zones) plotted alongside shareholder yield (buyback yield + dividend yield).
Useful for assessing cash return to shareholders relative to market cap.
FCFPS vs. DPS
Compares free cash flow per share to dividends per share over time. Shows the coverage buffer between what the company generates and what it pays out.
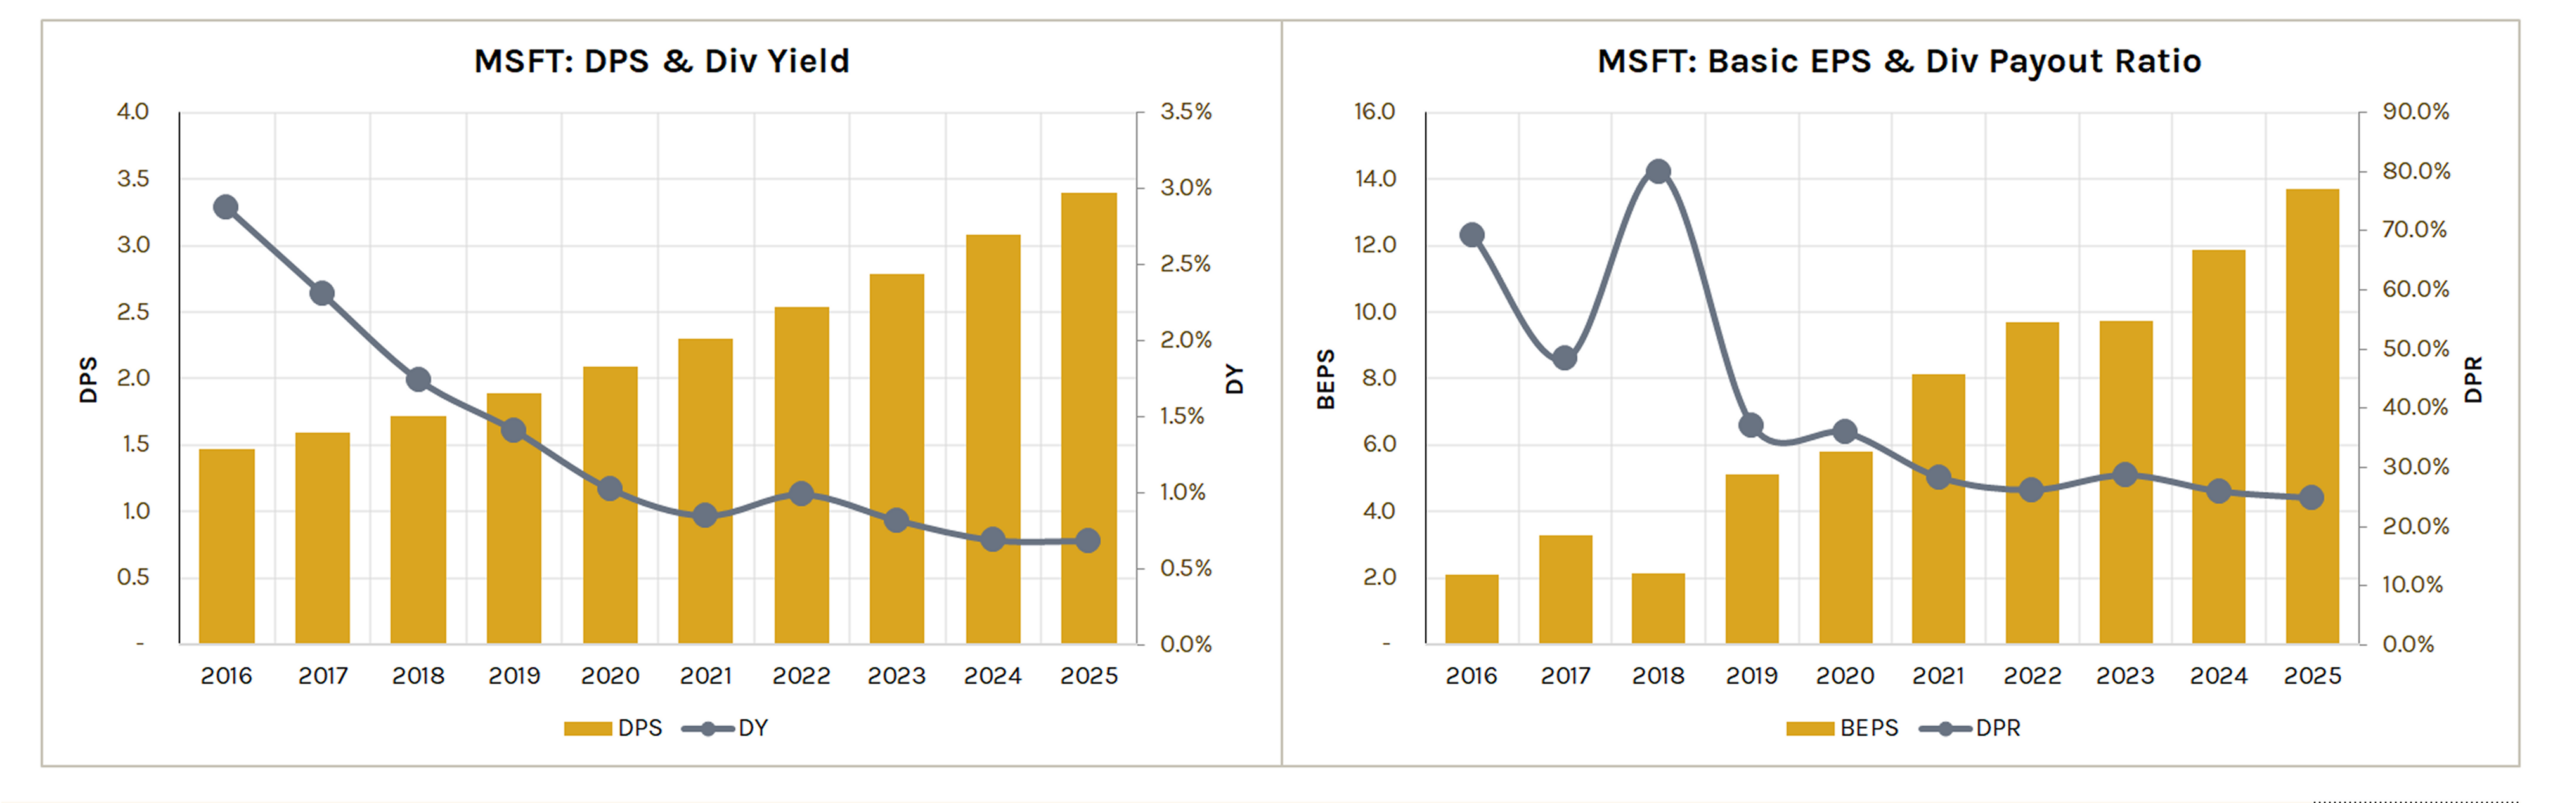
DPS & Dividend Yield
Tracks dividend per share and dividend yield over time.
Basic EPS & Dividend Payout Ratio
Plots basic EPS alongside the dividend payout ratio.
Useful for assessing earnings growth relative to dividend commitments.
Leverage & Liquidity
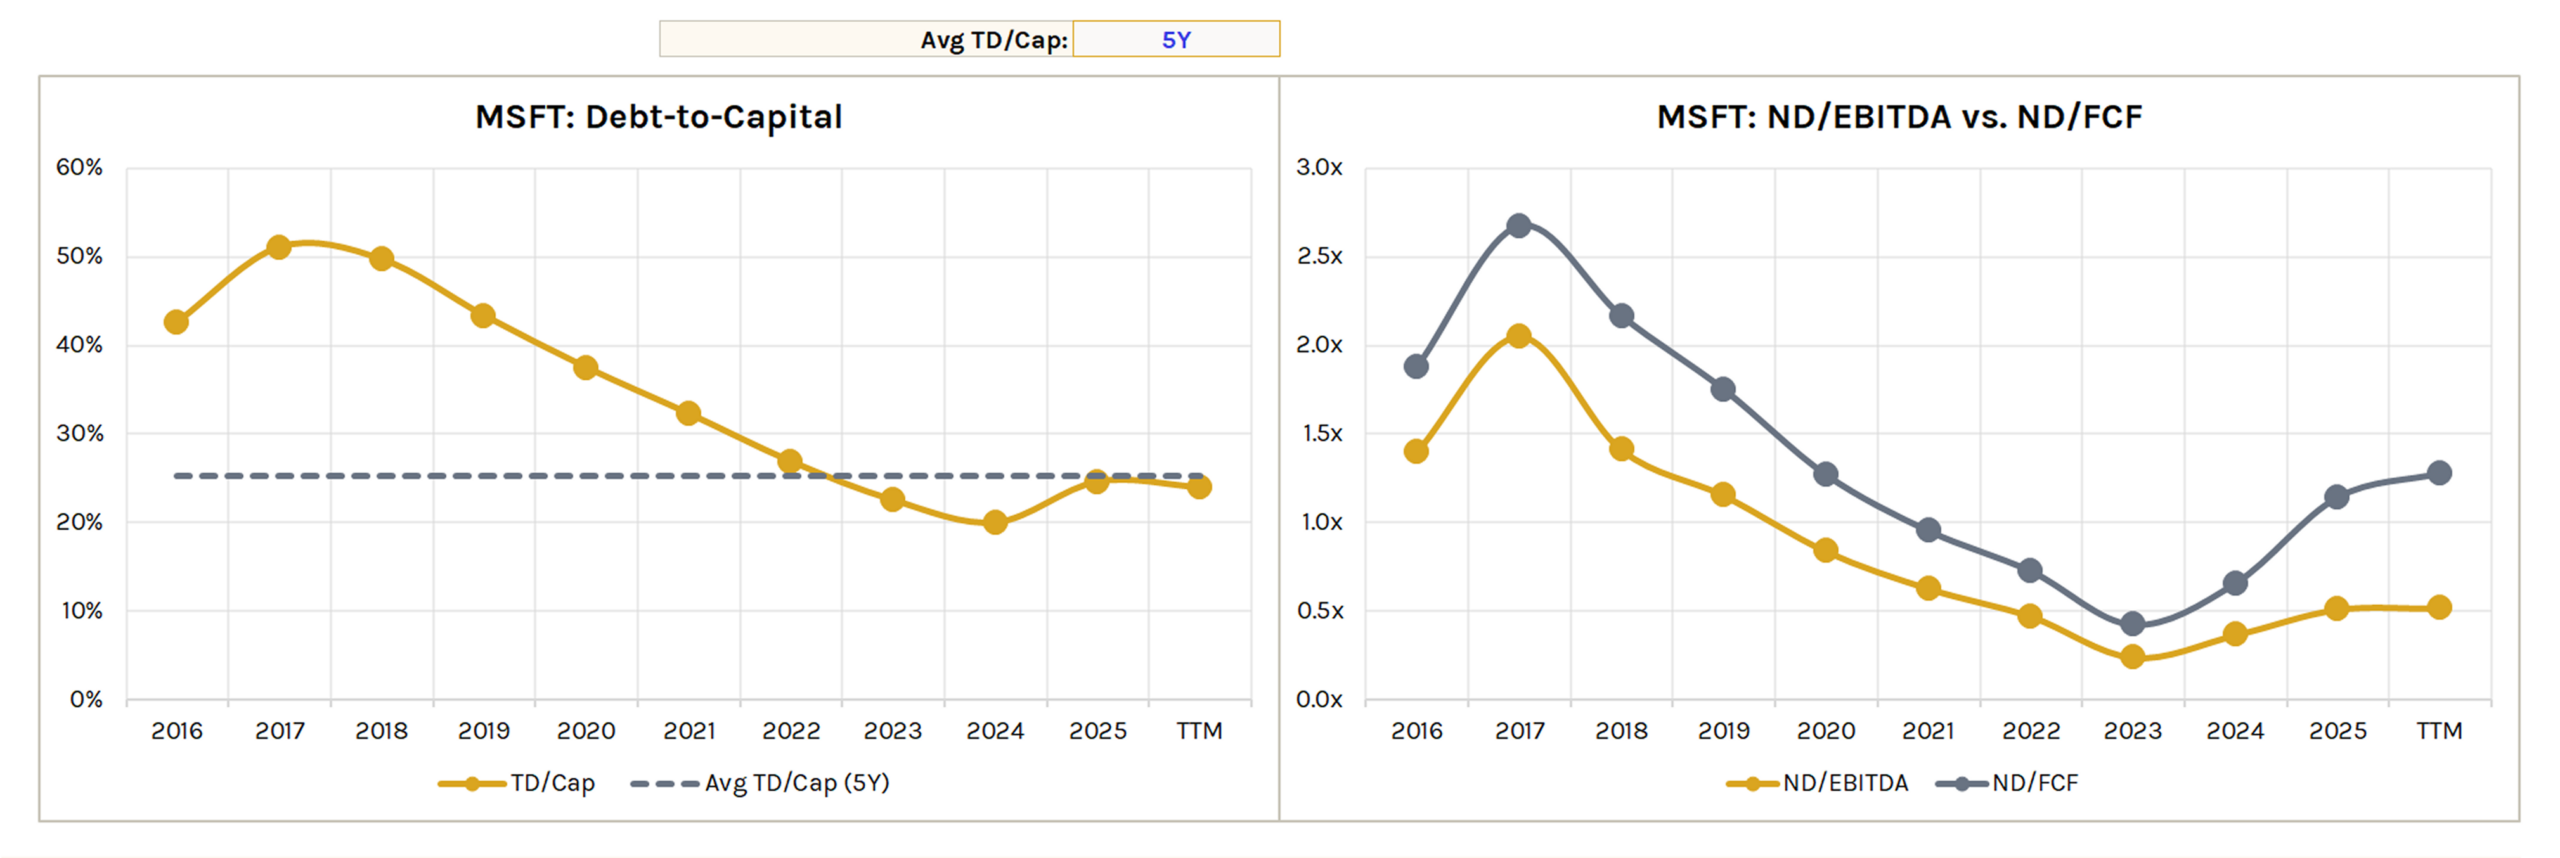
Debt-to-Capital
Plots total debt / total capitalization over time with a moving average line (selectable period).
ND/EBITDA vs. ND/FCF
Compares net debt to EBITDA and net debt to FCF leverage ratios over time.
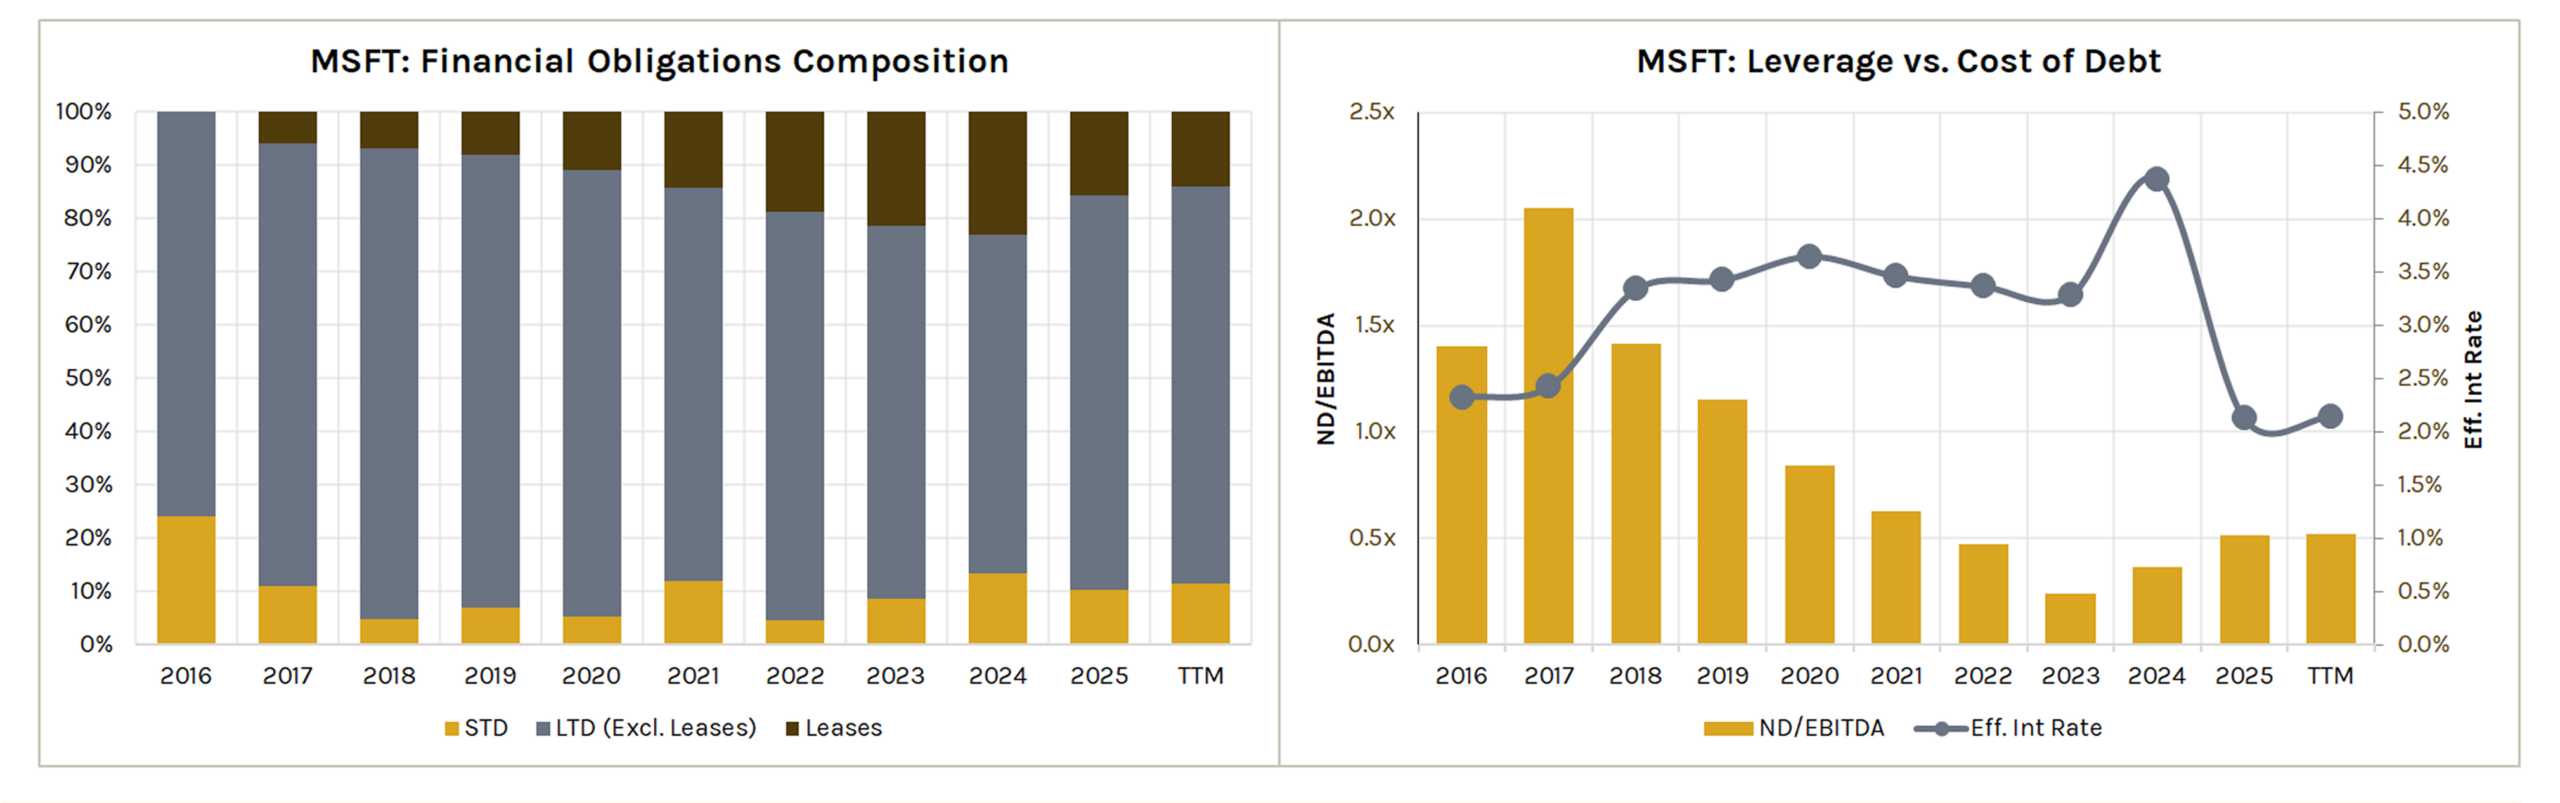
Financial Obligations Composition
100% stacked bar showing the breakdown of total debt into short-term debt, long-term debt (excluding leases), and leases.
Leverage vs. Cost of Debt
Plots ND/EBITDA alongside the effective interest rate (Interest Expense / Total Debt).
Useful for assessing whether leverage changes are impacting borrowing costs.
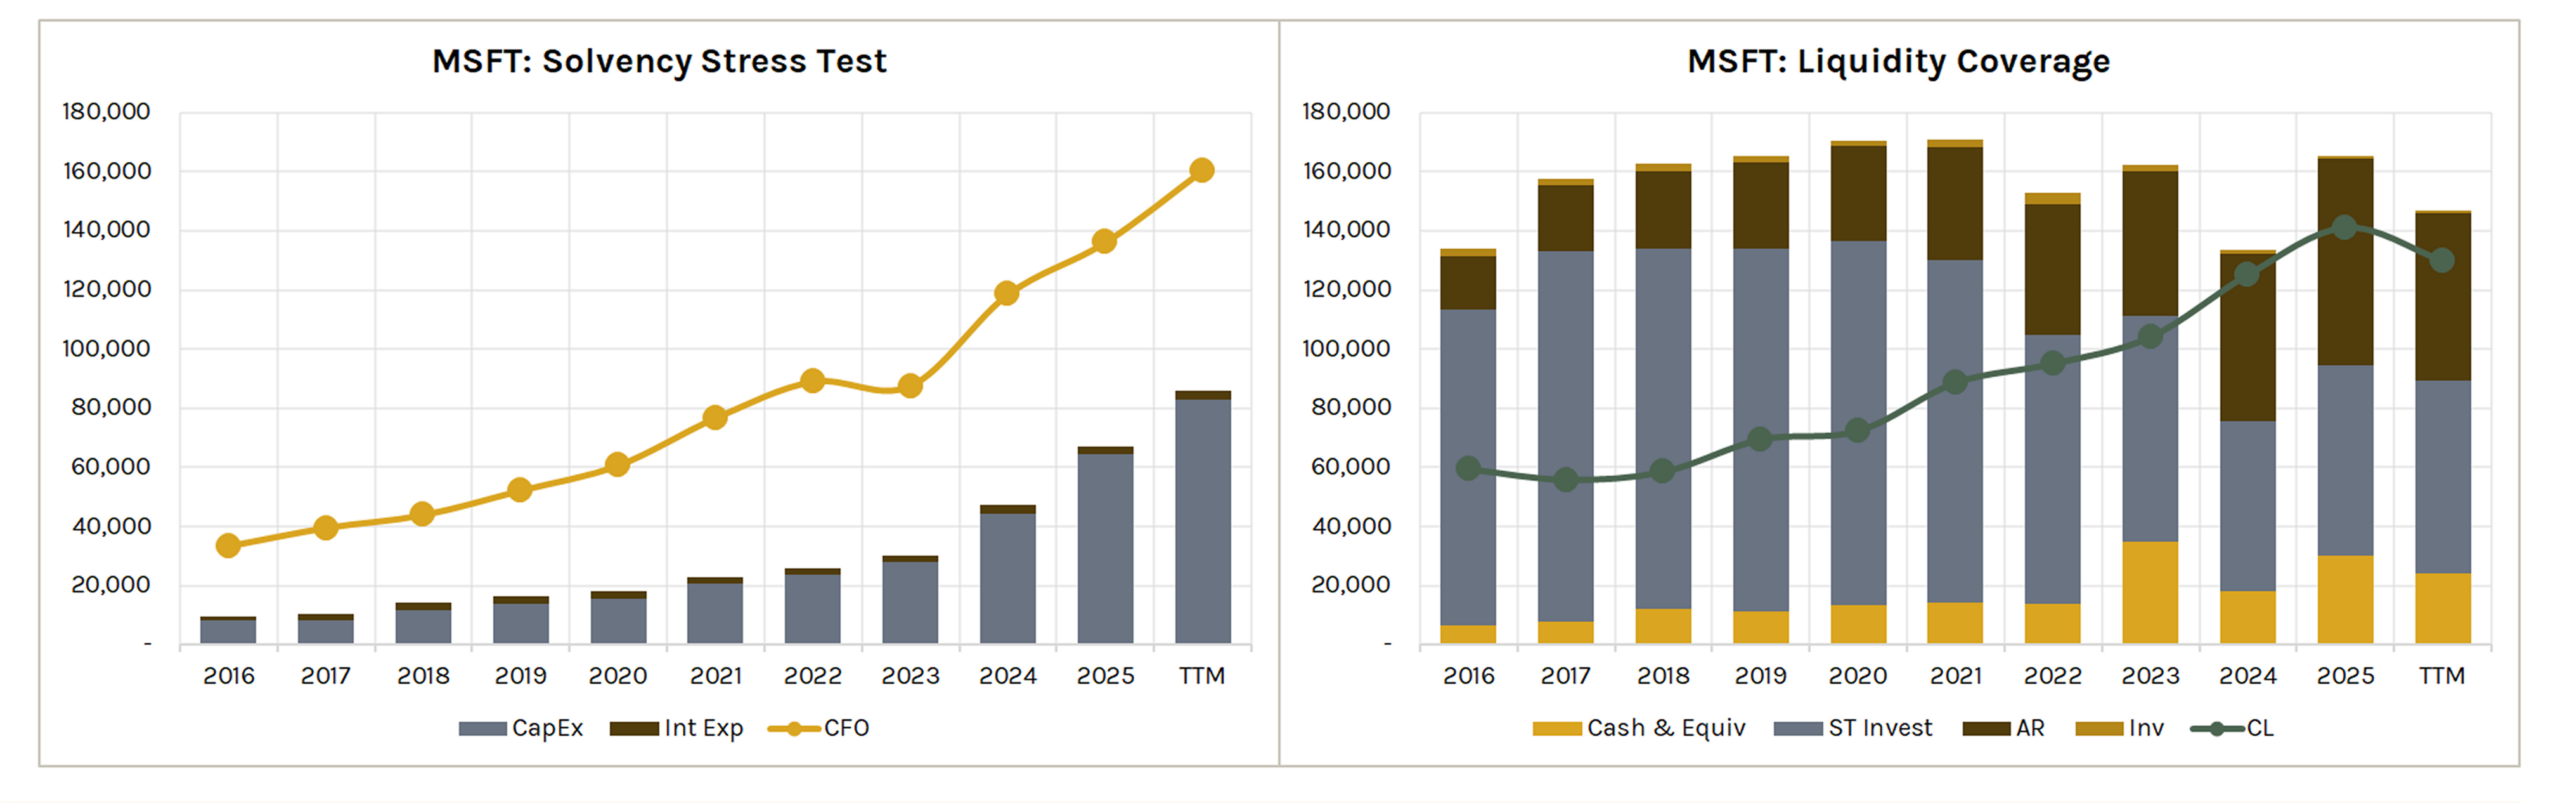
Solvency Stress Test
Stacked bar of CapEx + Interest Expense vs. CFO line.
Shows whether operating cash flow covers mandatory capital and debt service obligations.
Liquidity Coverage
Stacked bar of liquid assets (cash, short-term investments, AR, inventory) vs. current liabilities line.
Shows short-term coverage.
User Defined Charts
Accessible to Professional/Developer users only.
Custom Small Charts
12 custom chart slots. Select any metric from KFS or KFR, toggle between bar and line chart.
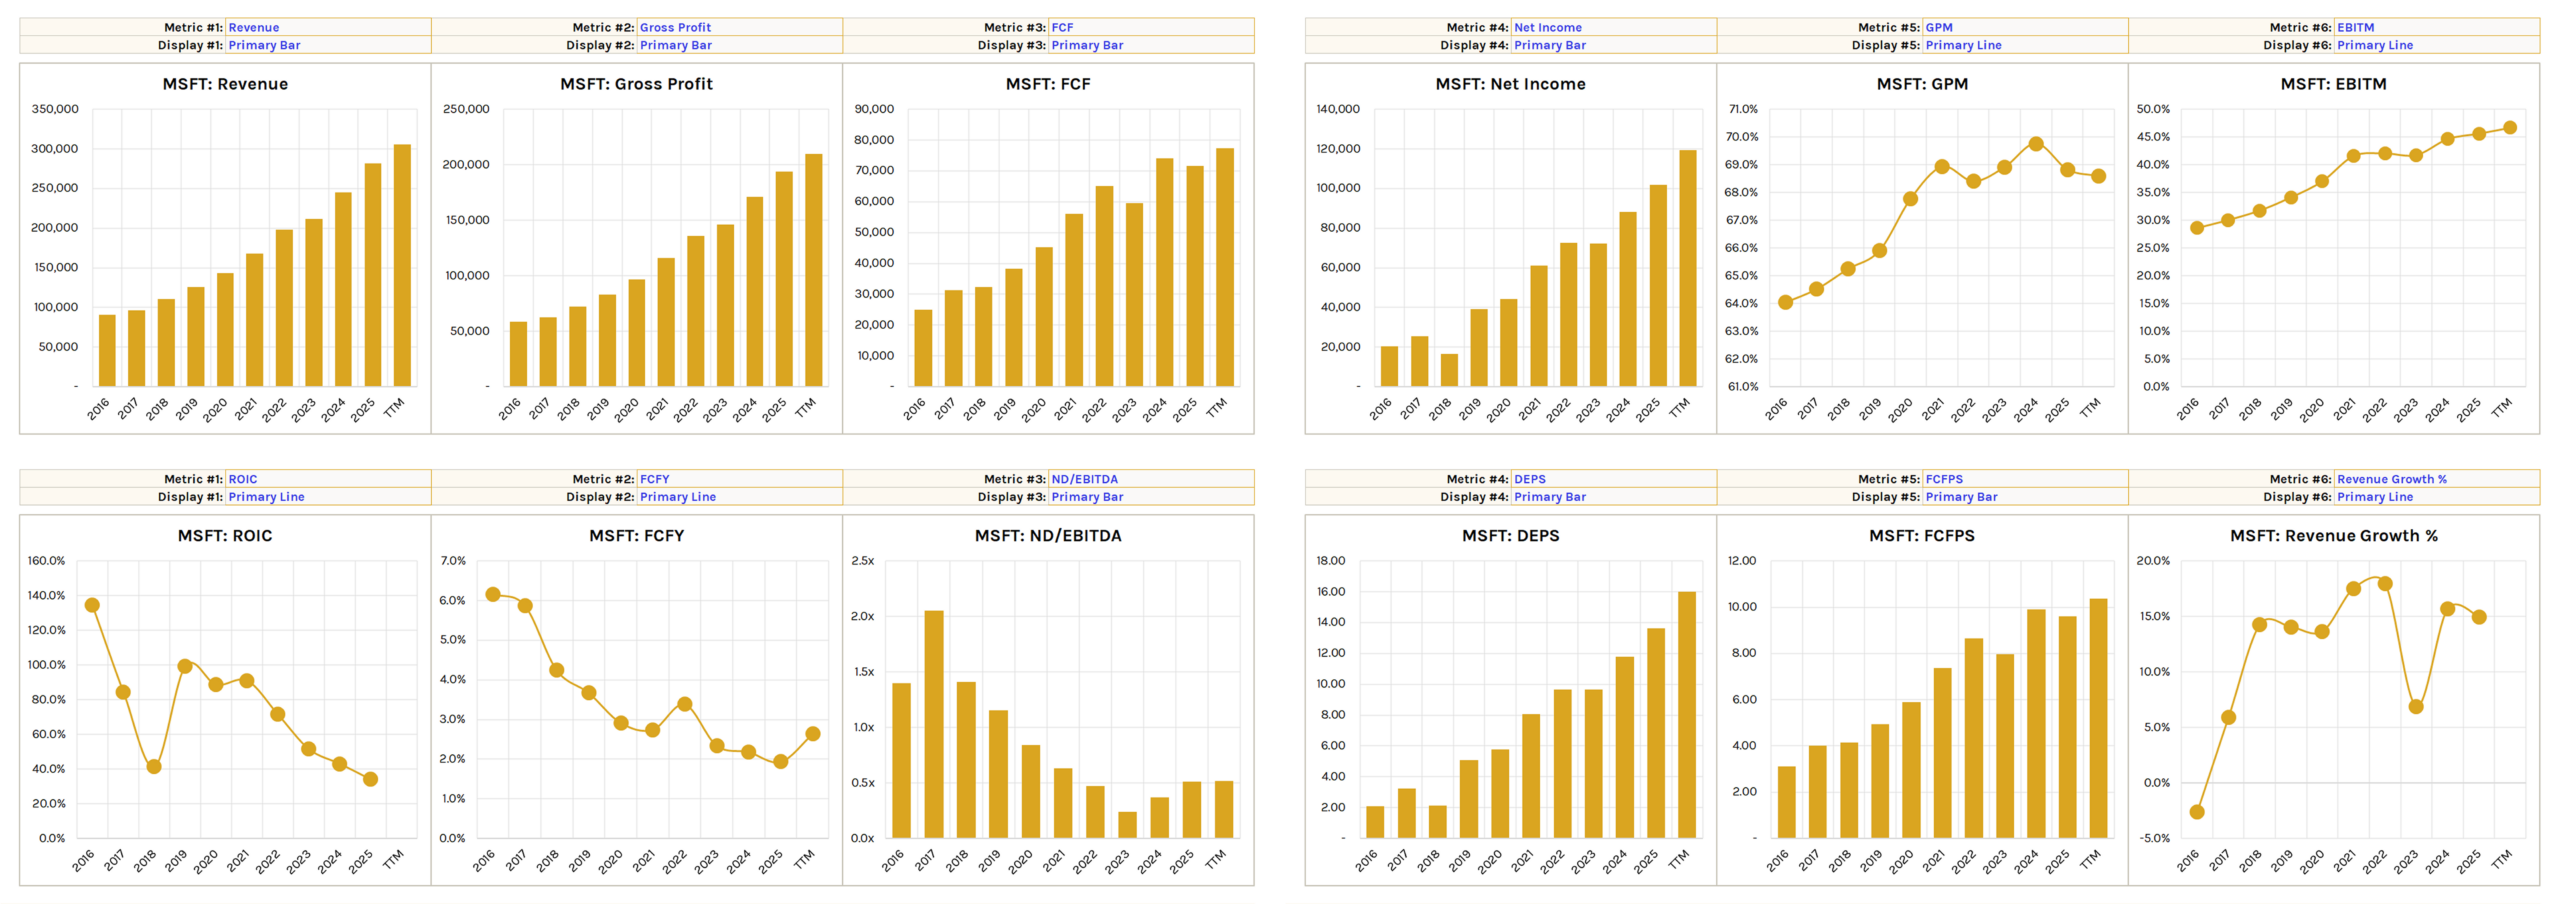
Value formats update automatically—not static like traditional Excel charts.
Comparison Charts
2 custom comparison charts. Plot up to 3 metrics across primary bar, primary line, and/or secondary line axes.
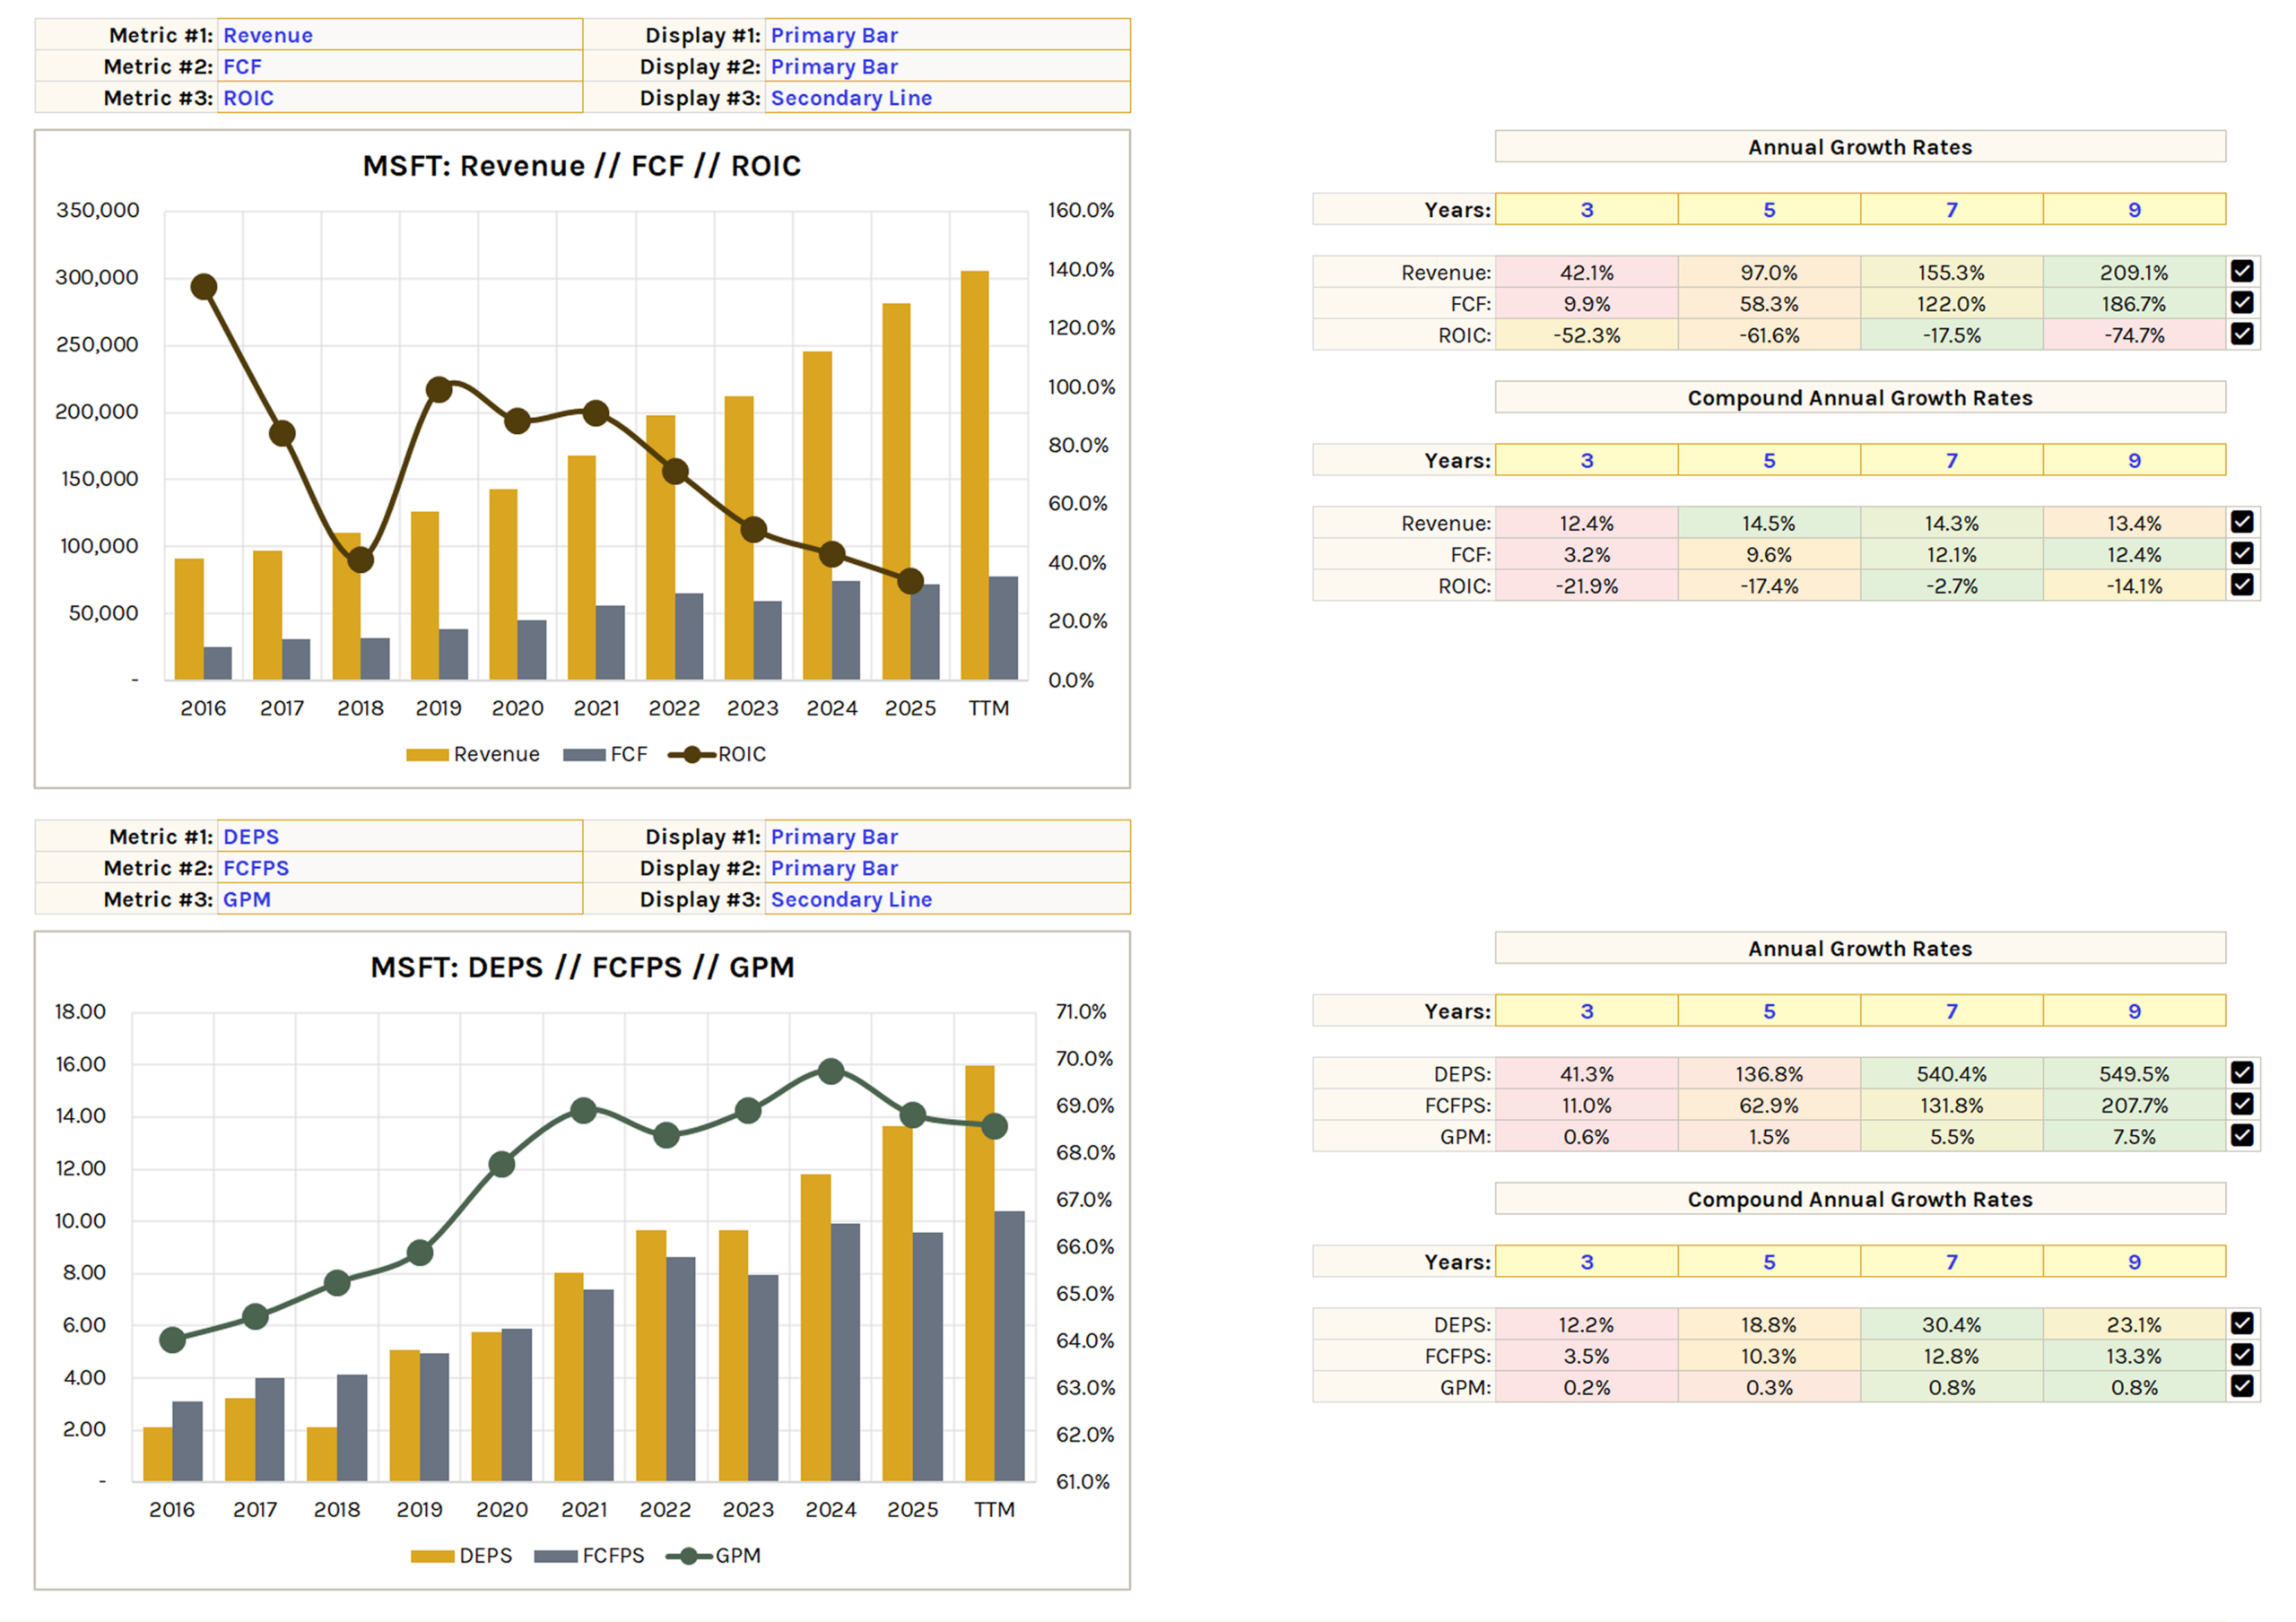
Includes a growth rate section with conditional format toggles.