

Table of Contents
Relevant: How to Estimate the Perpetual Dividend Growth Rate
DGA Overview
The Dividend Growth Analysis (DGA) tab analyzes historical dividends and earnings to help inform the stable (perpetual) dividend growth rate used in the Dividend Discount Model (DDM) tab.
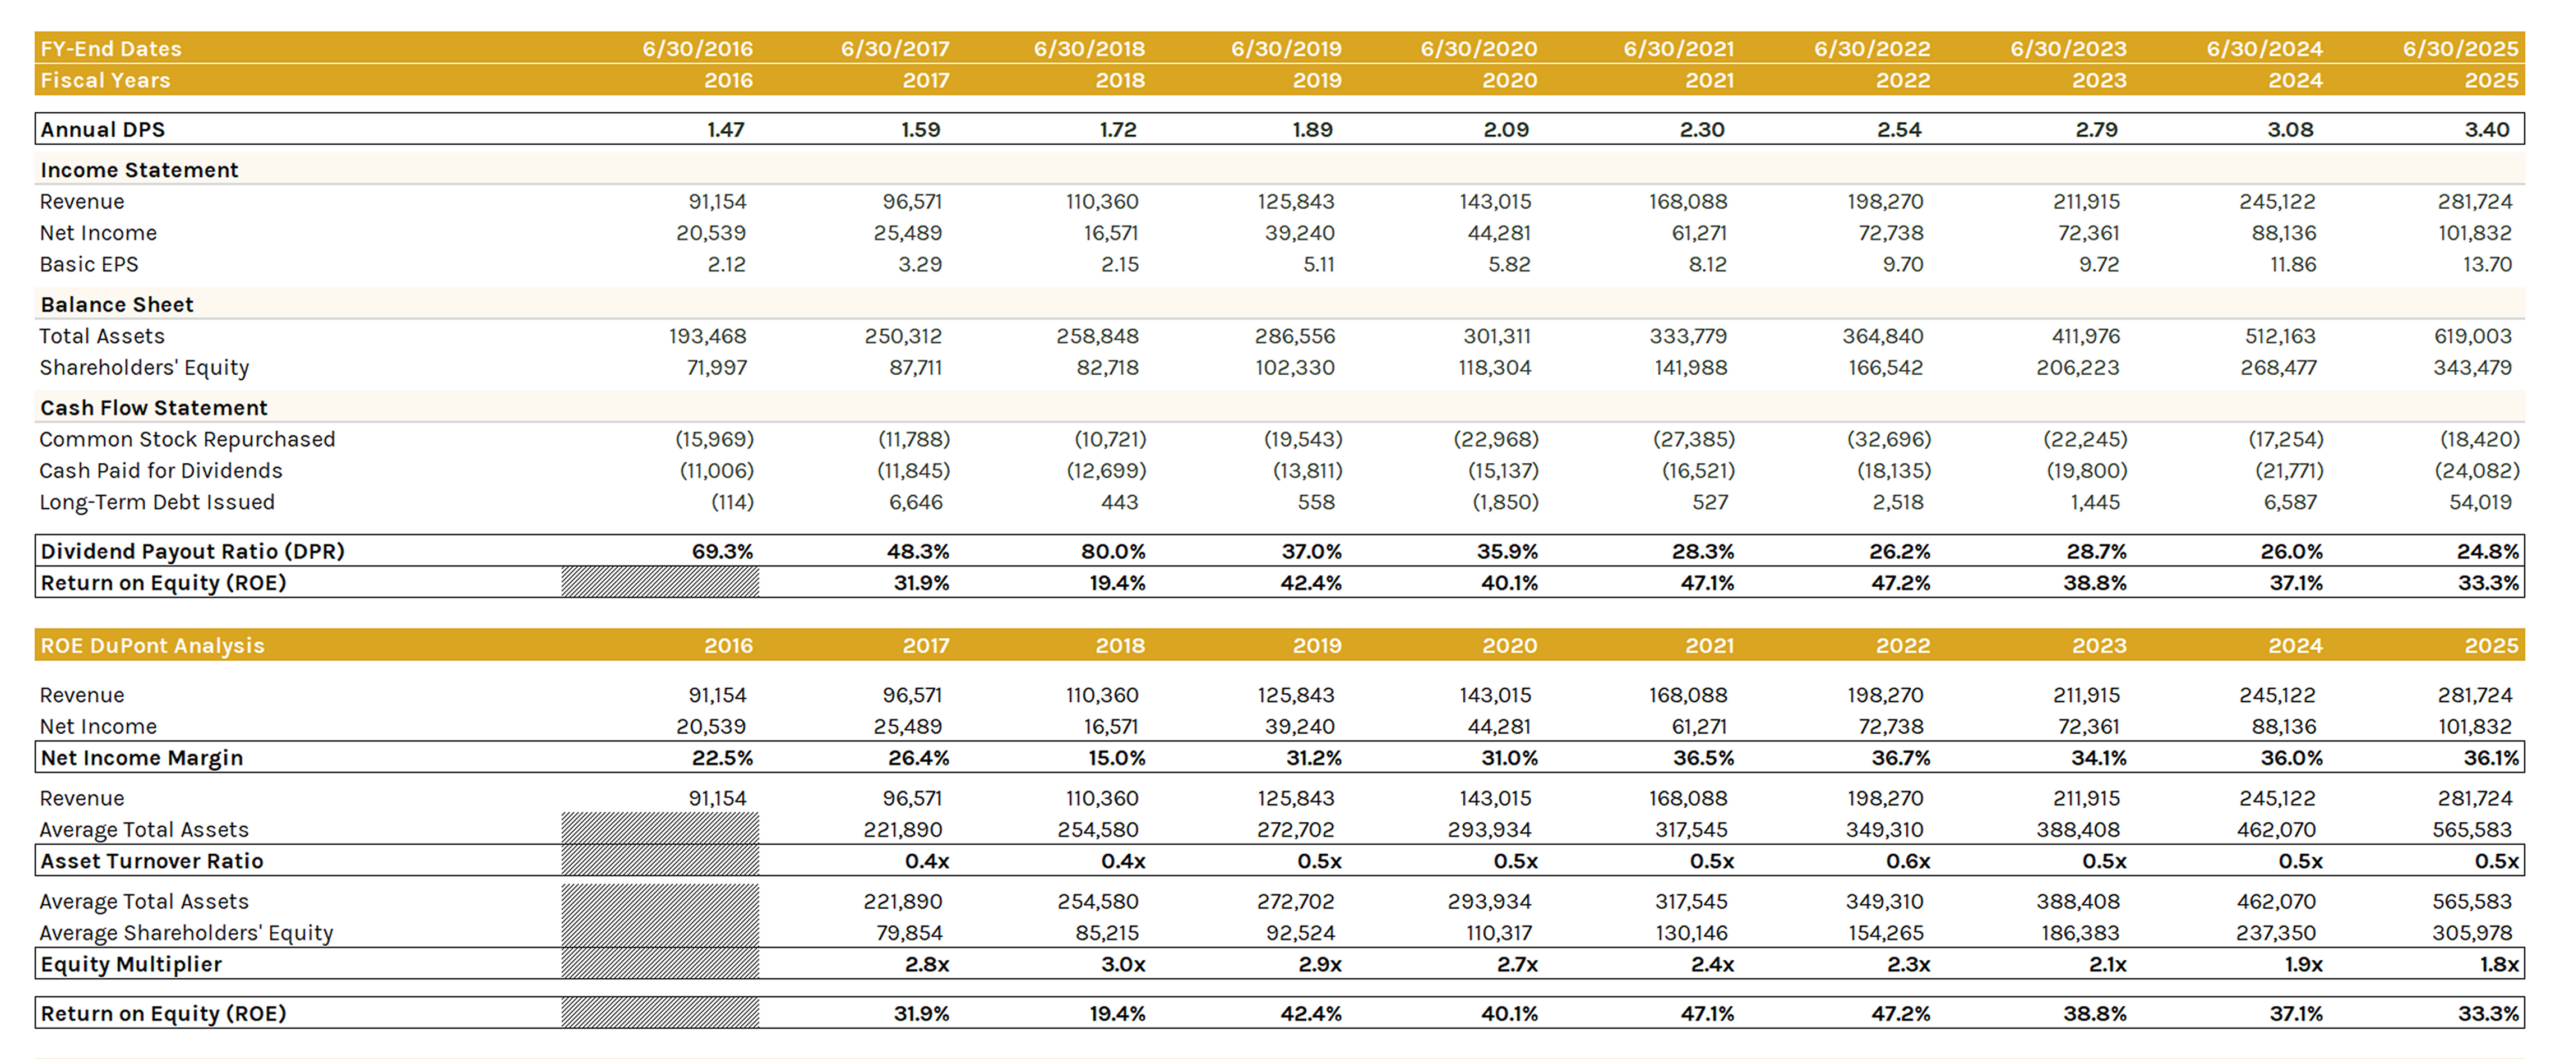
ROE DuPont Analysis
Decomposes ROE into its profitability, efficiency, and leverage drivers to better understand what's sustaining or limiting dividend growth capacity:
ROE = Net Income Margin × Asset Turnover Ratio × Equity Multiplier
Sustainable Growth Rates
DPR and ROE are calculated across the last 10 fiscal years from IS, BS, and CFS data:
- DPR shows what portion of earnings is paid as dividends.
- ROE shows the return generated on shareholders' equity.
Both feed directly into the three sustainable growth rate (SGR) formulas below:
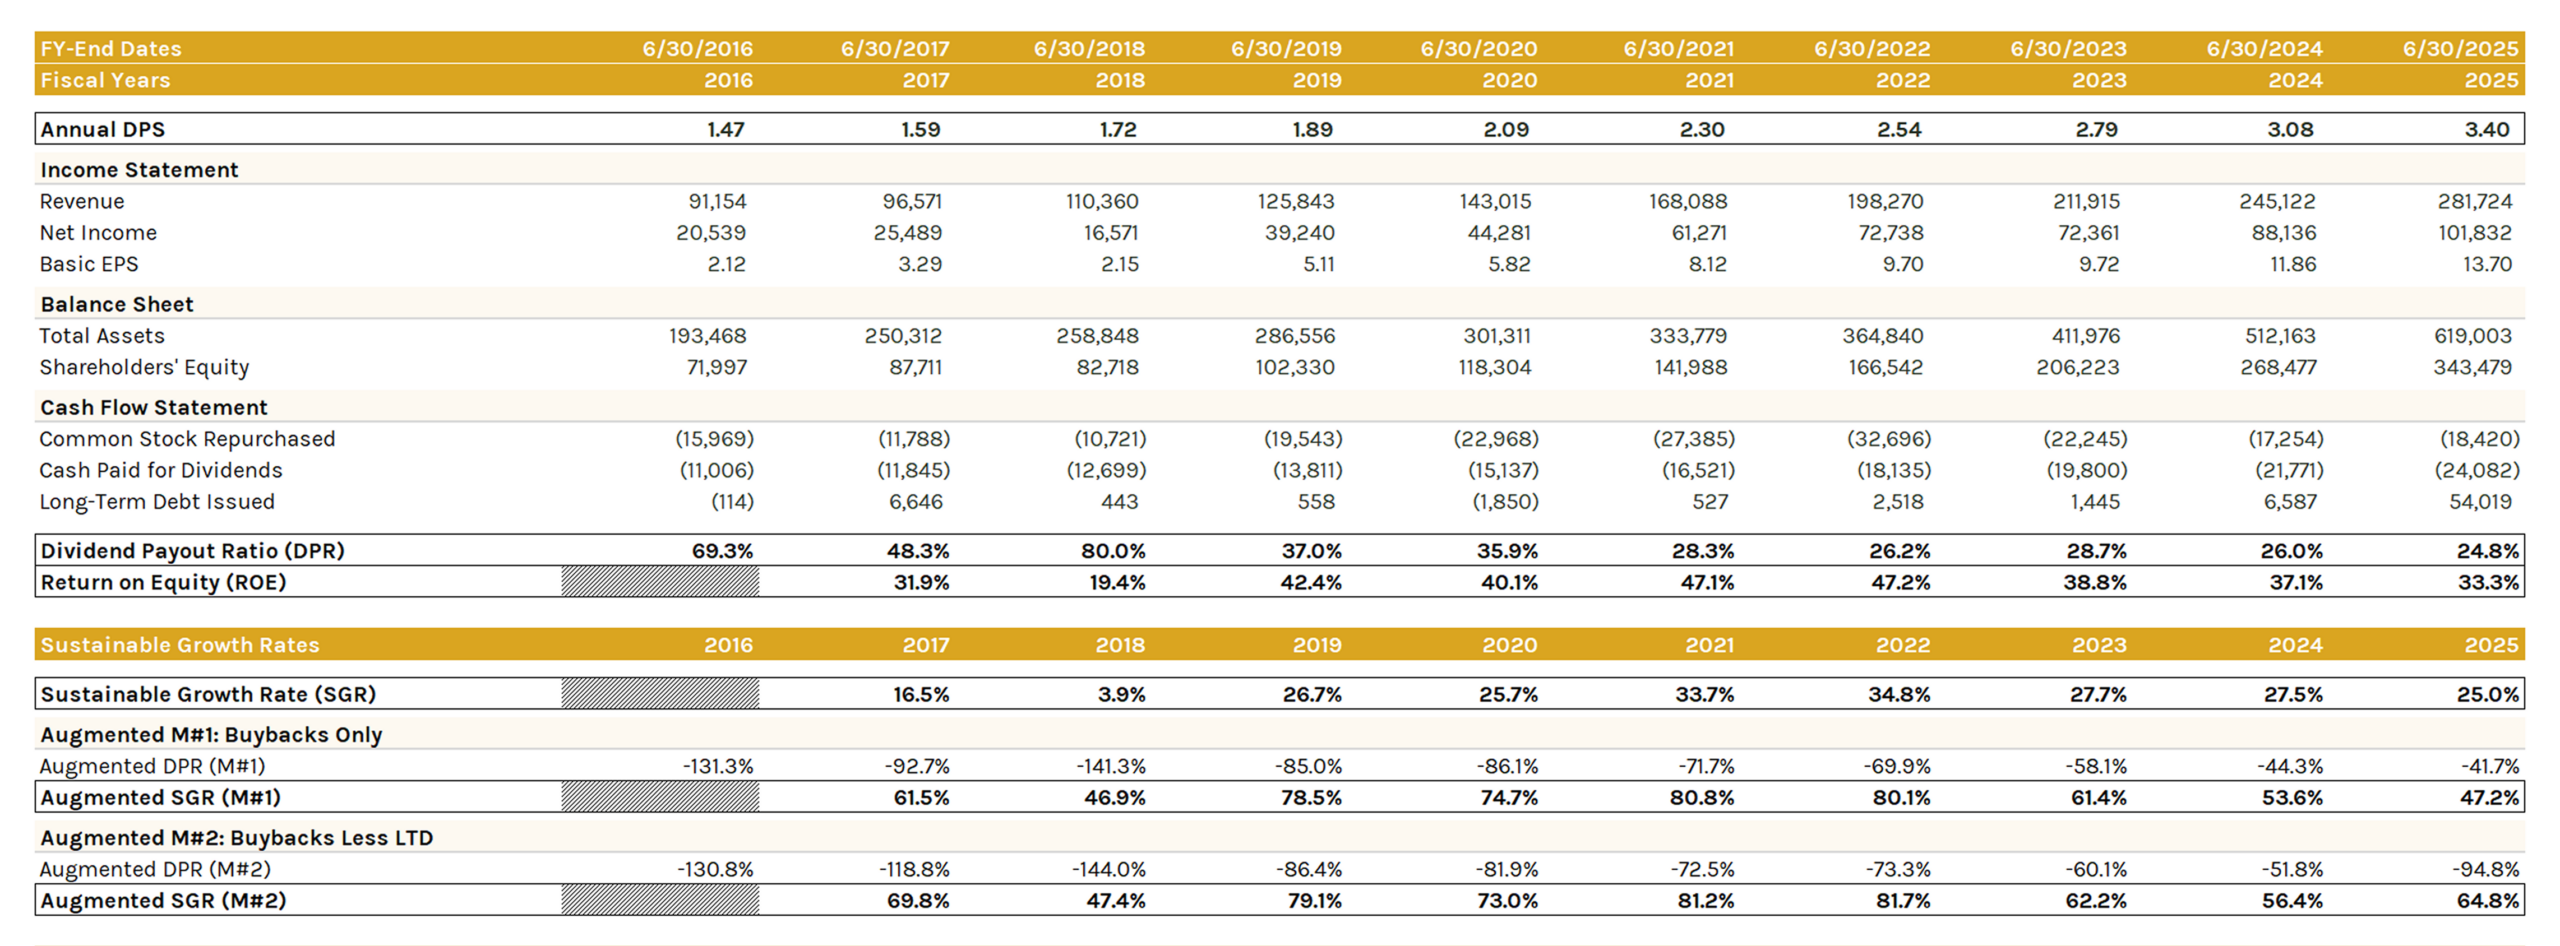
Standard SGR
SGR = ROE × (1 - DPR)
Augmented M#1 (Buybacks Only)
Augmented DPR = (Dividends + Stock Buybacks) / Net Income
Augmented SGR = ROE × (1 - Augmented DPR)
Augmented M#2 (Buybacks Less LTD)
Augmented DPR = (Dividends + Stock Buybacks - New Long-Term Debt Issued) / Net Income
Augmented SGR = ROE × (1 - Augmented DPR)
M#2 accounts for companies funding buybacks with debt, which overstates sustainable growth under M#1.
Growth Rate Analysis
Avg Growth Rate Analysis
Displays average DPS growth rates across 1Y to 9Y periods, with average and median summary rows.

Conditional formatting highlights growth rate magnitude.
CAGR Analysis
Displays DPS CAGRs across 1Y to 9Y periods, with average and median summary rows.

Same conditional formatting as the Avg Growth Rate section.