

Table of Contents
Relevant: Free Cash Flow Articles
FCFF Model
Free Cash Flow to the Firm (FCFF) forecasts unlevered free cash flows, which serves as a forecast option on the DCF tab.
FCFF represents cash flow from operations available for distribution after accounting for depreciation, taxes, working capital, and investments:
FCFF = EBIAT (aka NOPAT) + D&A - CapEx - Change in Non-Cash NWC
where:
- EBIAT (aka NOPAT): Operating profit adjusted for taxes, excluding interest expense.
- D&A: Depreciation and amortization.
- CapEx: Capital expenditures.
- Change in Non-Cash NWC: Year-over-year change in non-cash net working capital.
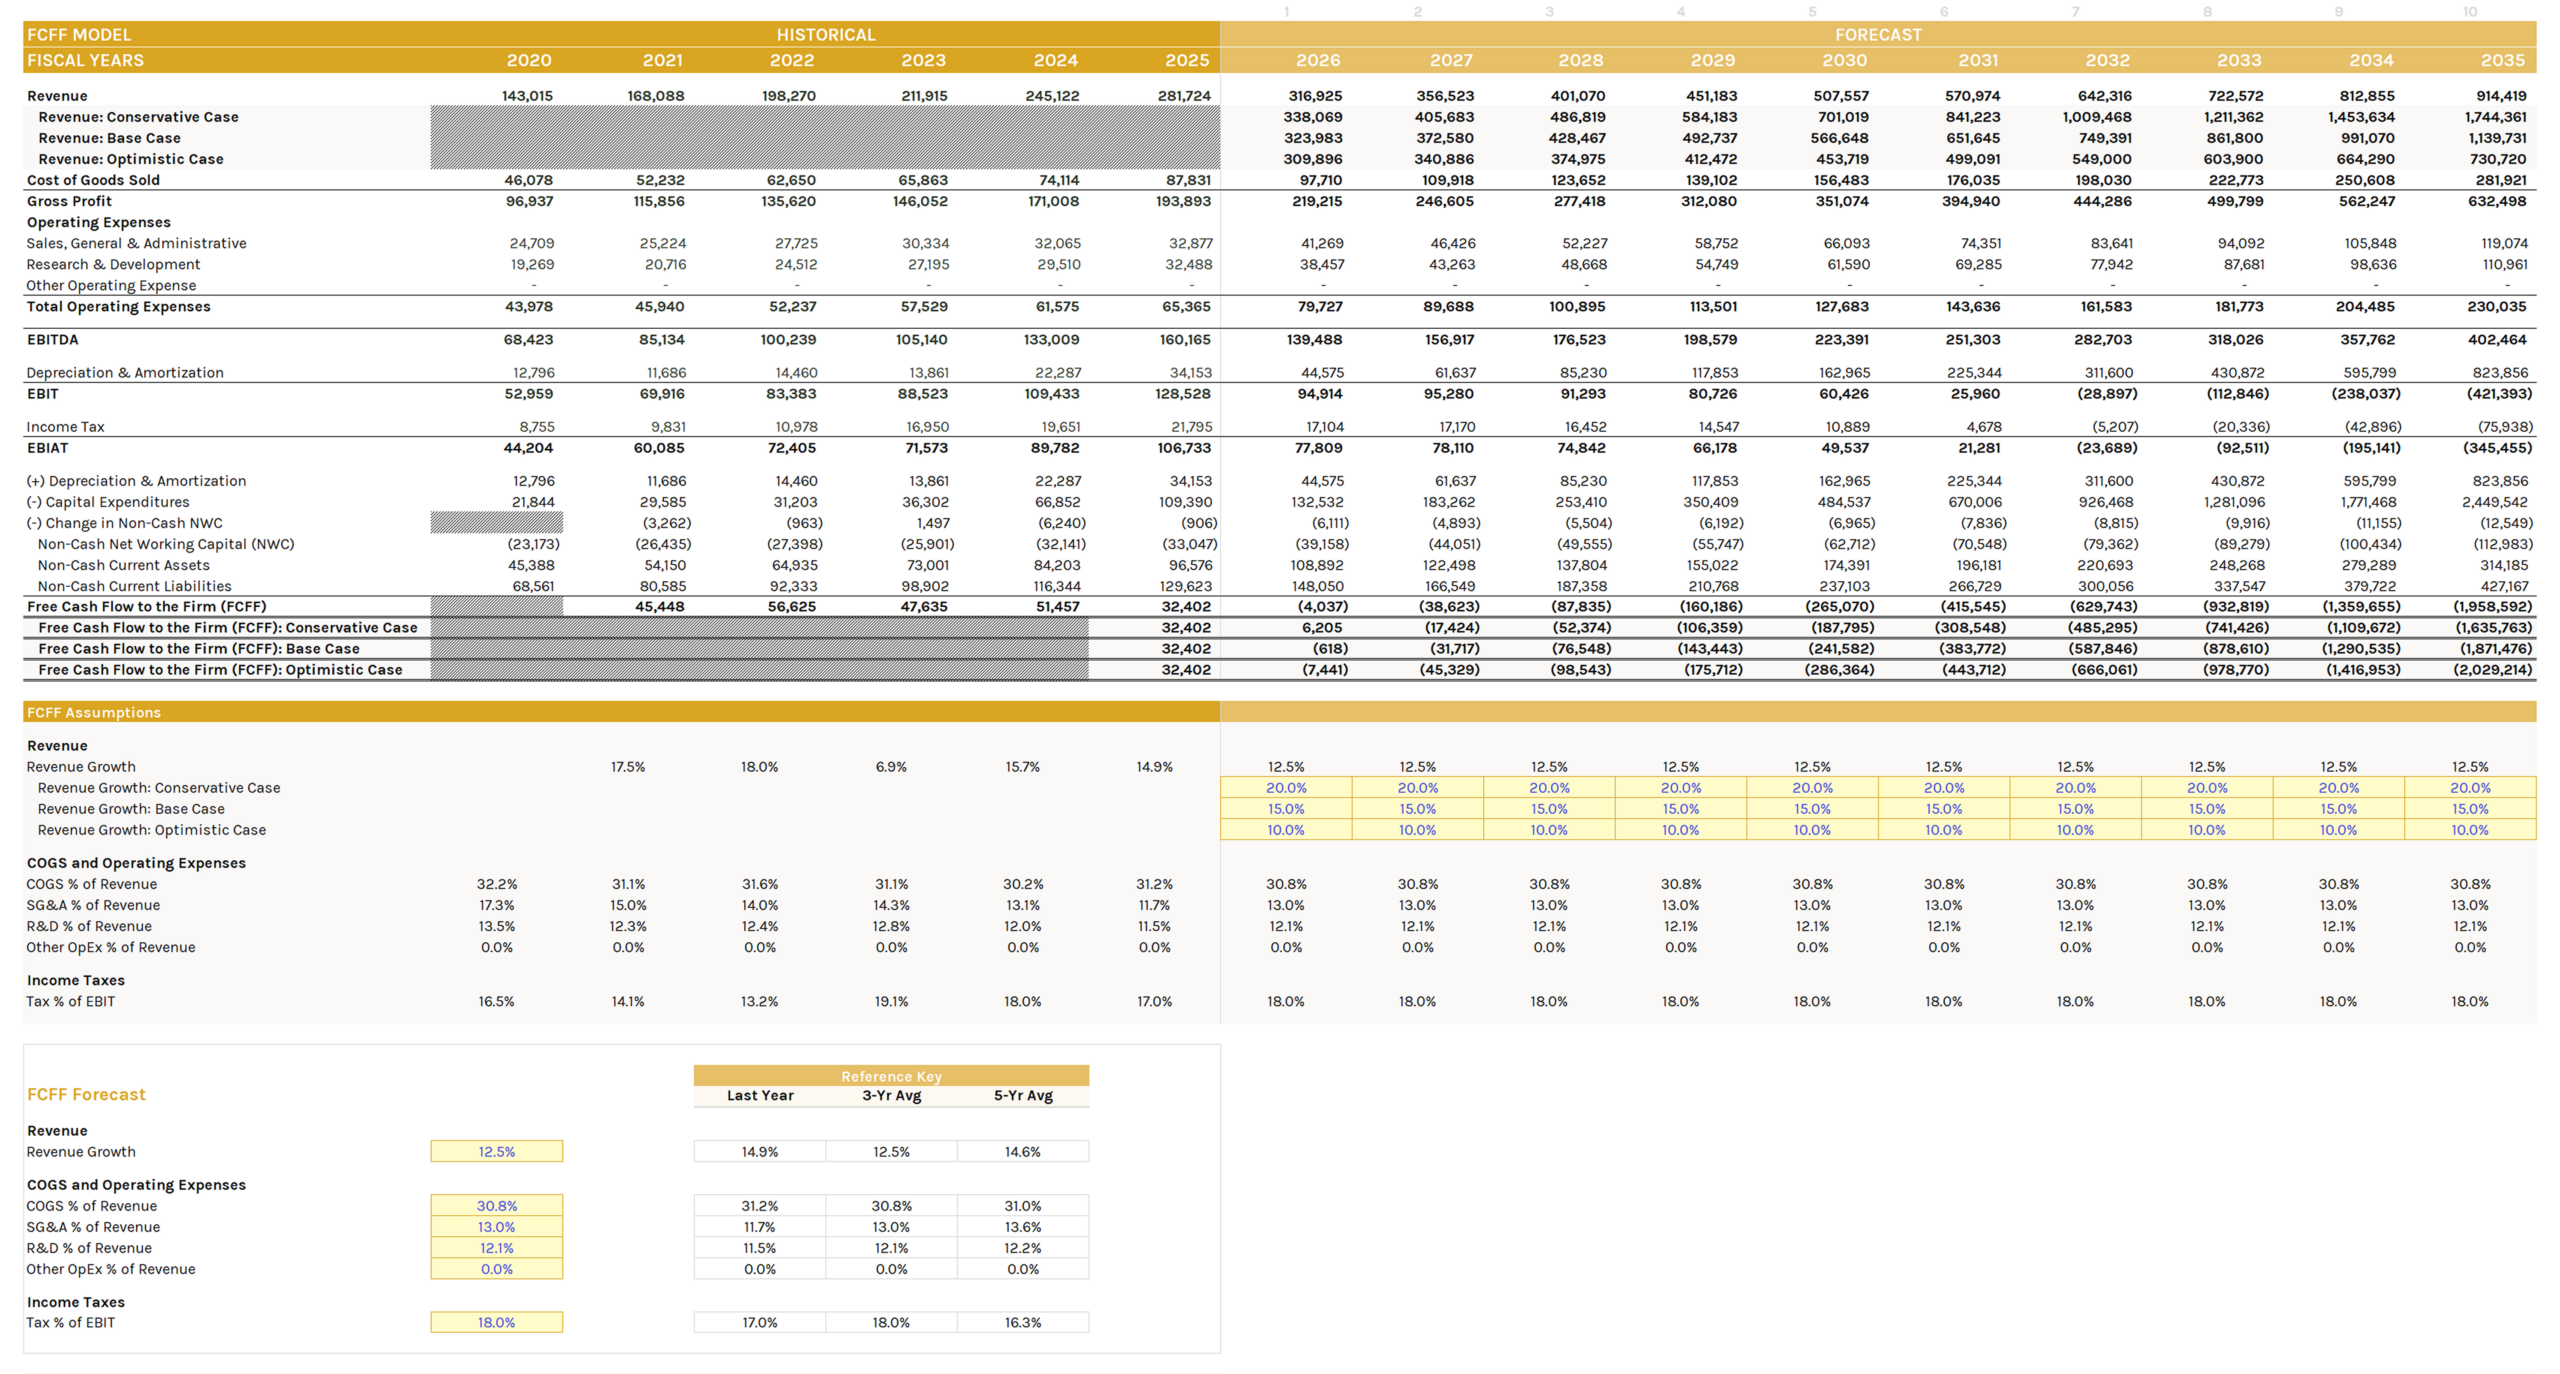
The model calculates FCFF in the following steps:
- Revenue forecasting: Based on growth assumptions (conservative, base, and optimistic scenarios).
- EBITDA: Revenue less operating costs (COGS, SG&A, R&D, Other OpEx—each forecasted as % of revenue).
- EBIT: EBITDA less D&A.
- EBIAT/NOPAT: EBIT less taxes (tax rate as % of EBIT).
- FCFF: EBIAT + D&A − CapEx − Change in Non-Cash NWC.
The FCFF model features 6 years of historical data from the Analysis Year, with up to 10 years of forecast.
The Forecast sections provide reference data for all forecastable line items (last year, 3-year avg, and 5-year avg).
Fixed Assets Schedule
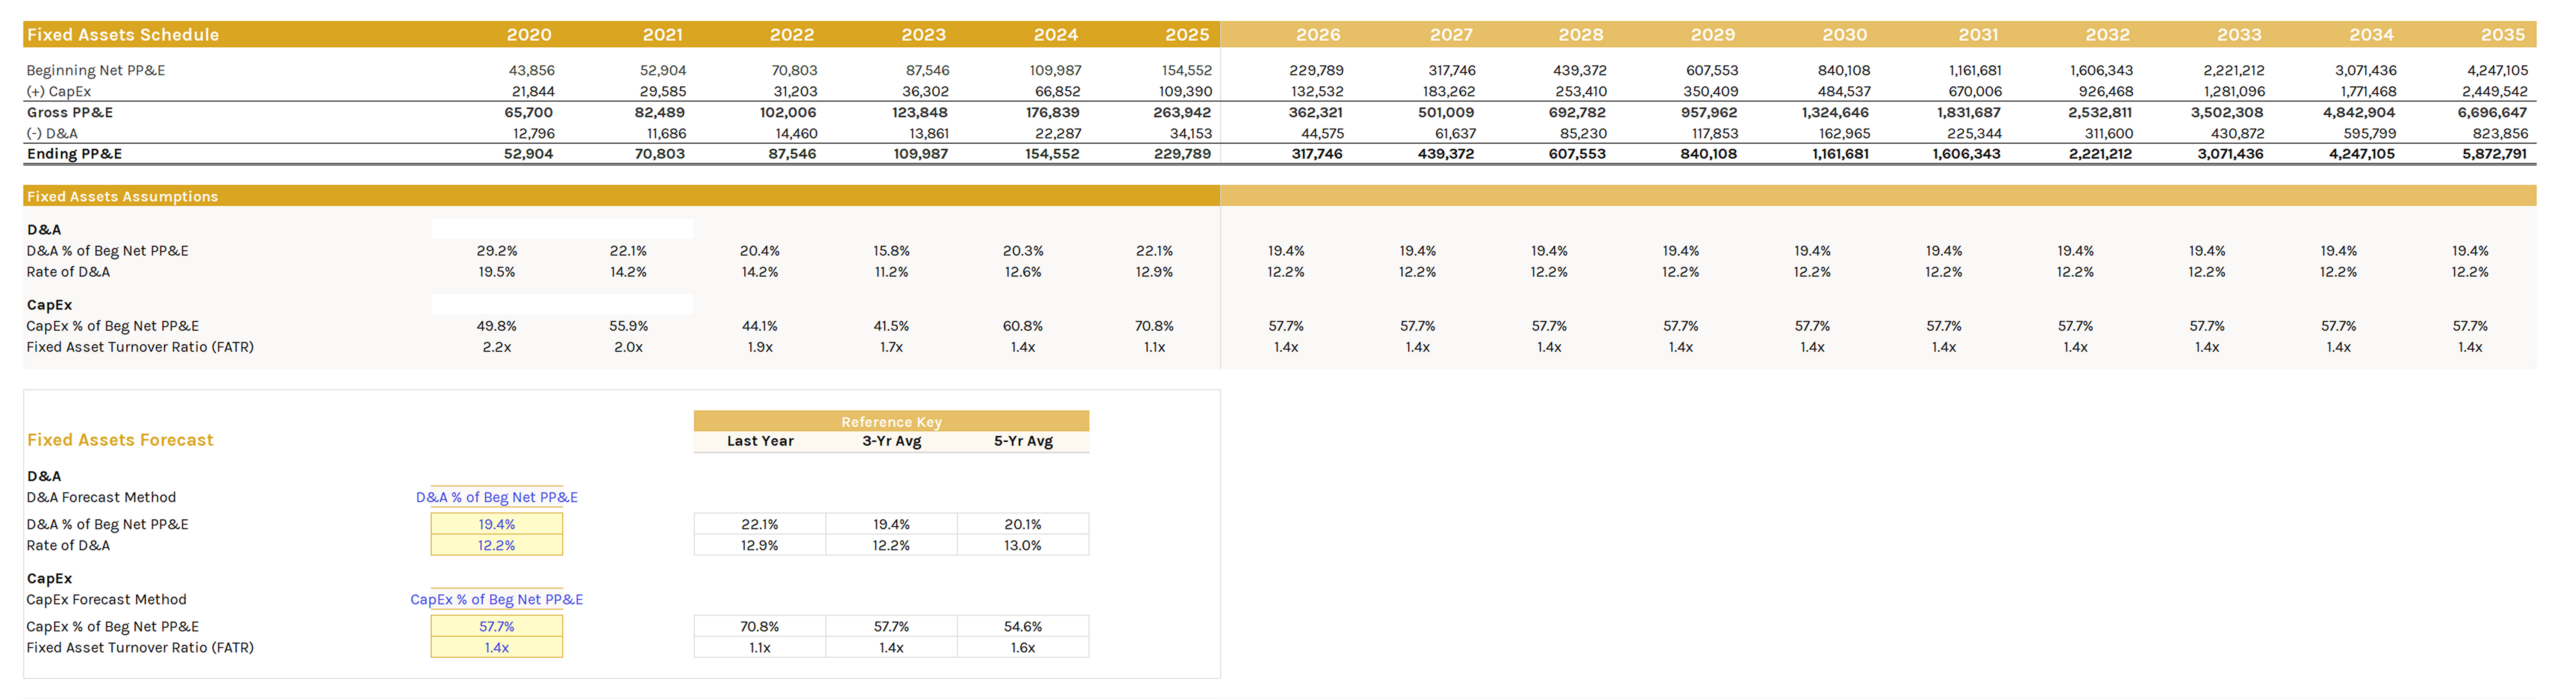
The fixed assets schedule tracks and forecasts PP&E. Calculation flow:
- Beginning Net PP&E: Starting net book value of fixed assets.
- (+) CapEx: CapEx added during the period.
- Gross PP&E: Total asset value before depreciation.
- (-) D&A: D&A expense for the period.
- Ending Net PP&E: Final net book value after depreciation.
Historical CapEx is derived as:
CapEx = Ending Net PP&E - Beginning Net PP&E + D&A
Depreciation & Amortization (D&A)
Two primary methods exist for forecasting D&A:
Method #1: D&A as Percentage of Beginning Net PP&E
Forecast D&A = Forecast Beginning Net PP&E × Forecast D&A % of Beginning Net PP&E %
Most applicable when:
- Company has undergone recent changes in asset base or D&A policies.
- Latest D&A-to-asset ratio better indicates future trends.
- Company is expanding or there are other significant operational changes.
Method #2: Rate of D&A Method
Forecast D&A = Forecast Gross PP&E × Forecast Rate of D&A
where:
- Rate of D&A = D&A / Gross PP&E
Most applicable when:
- Company has stable asset compositions and unchanging D&A policies.
- Historical rates will likely remain relevant for future periods.
- Industry has standardized asset lives and depreciation methods.
Capital Expenditures (CapEx)
Two primary methods exist for forecasting CapEx:
Method #1: CapEx as Percentage of Beginning Net PP&E
Forecast CapEx = Forecast Beginning Net PP&E × Forecast CapEx % of Beginning Net PP&E
Most applicable when:
- Company has regular maintenance and replacement cycles.
- No major expansion plans are anticipated.
Method #2: Fixed Asset Turnover Ratio Method
First, calculate the forecast gross PP&E using revenue projections:
Forecast Gross PP&E = Forecast Revenue / Forecast Fixed Asset Turnover Ratio.
where:
- Fixed Asset Turnover Ratio = Revenue / Gross PP&E
Then, determine the required CapEx:
Forecast CapEx = Forecast Ending Net PP&E - Forecast Beginning Net PP&E + Forecast D&A
Most applicable when:
- Company has stable operational efficiency.
- Asset utilization is a key performance indicator.
- Revenue growth is the primary driver of asset needs.
Note: When FATR is selected, forecast gross PP&E is based on last year, 3-year, or 5-year avg revenue growth (not base, conservative or optimistic).
Non-Cash Net Working Capital (NWC) Schedule
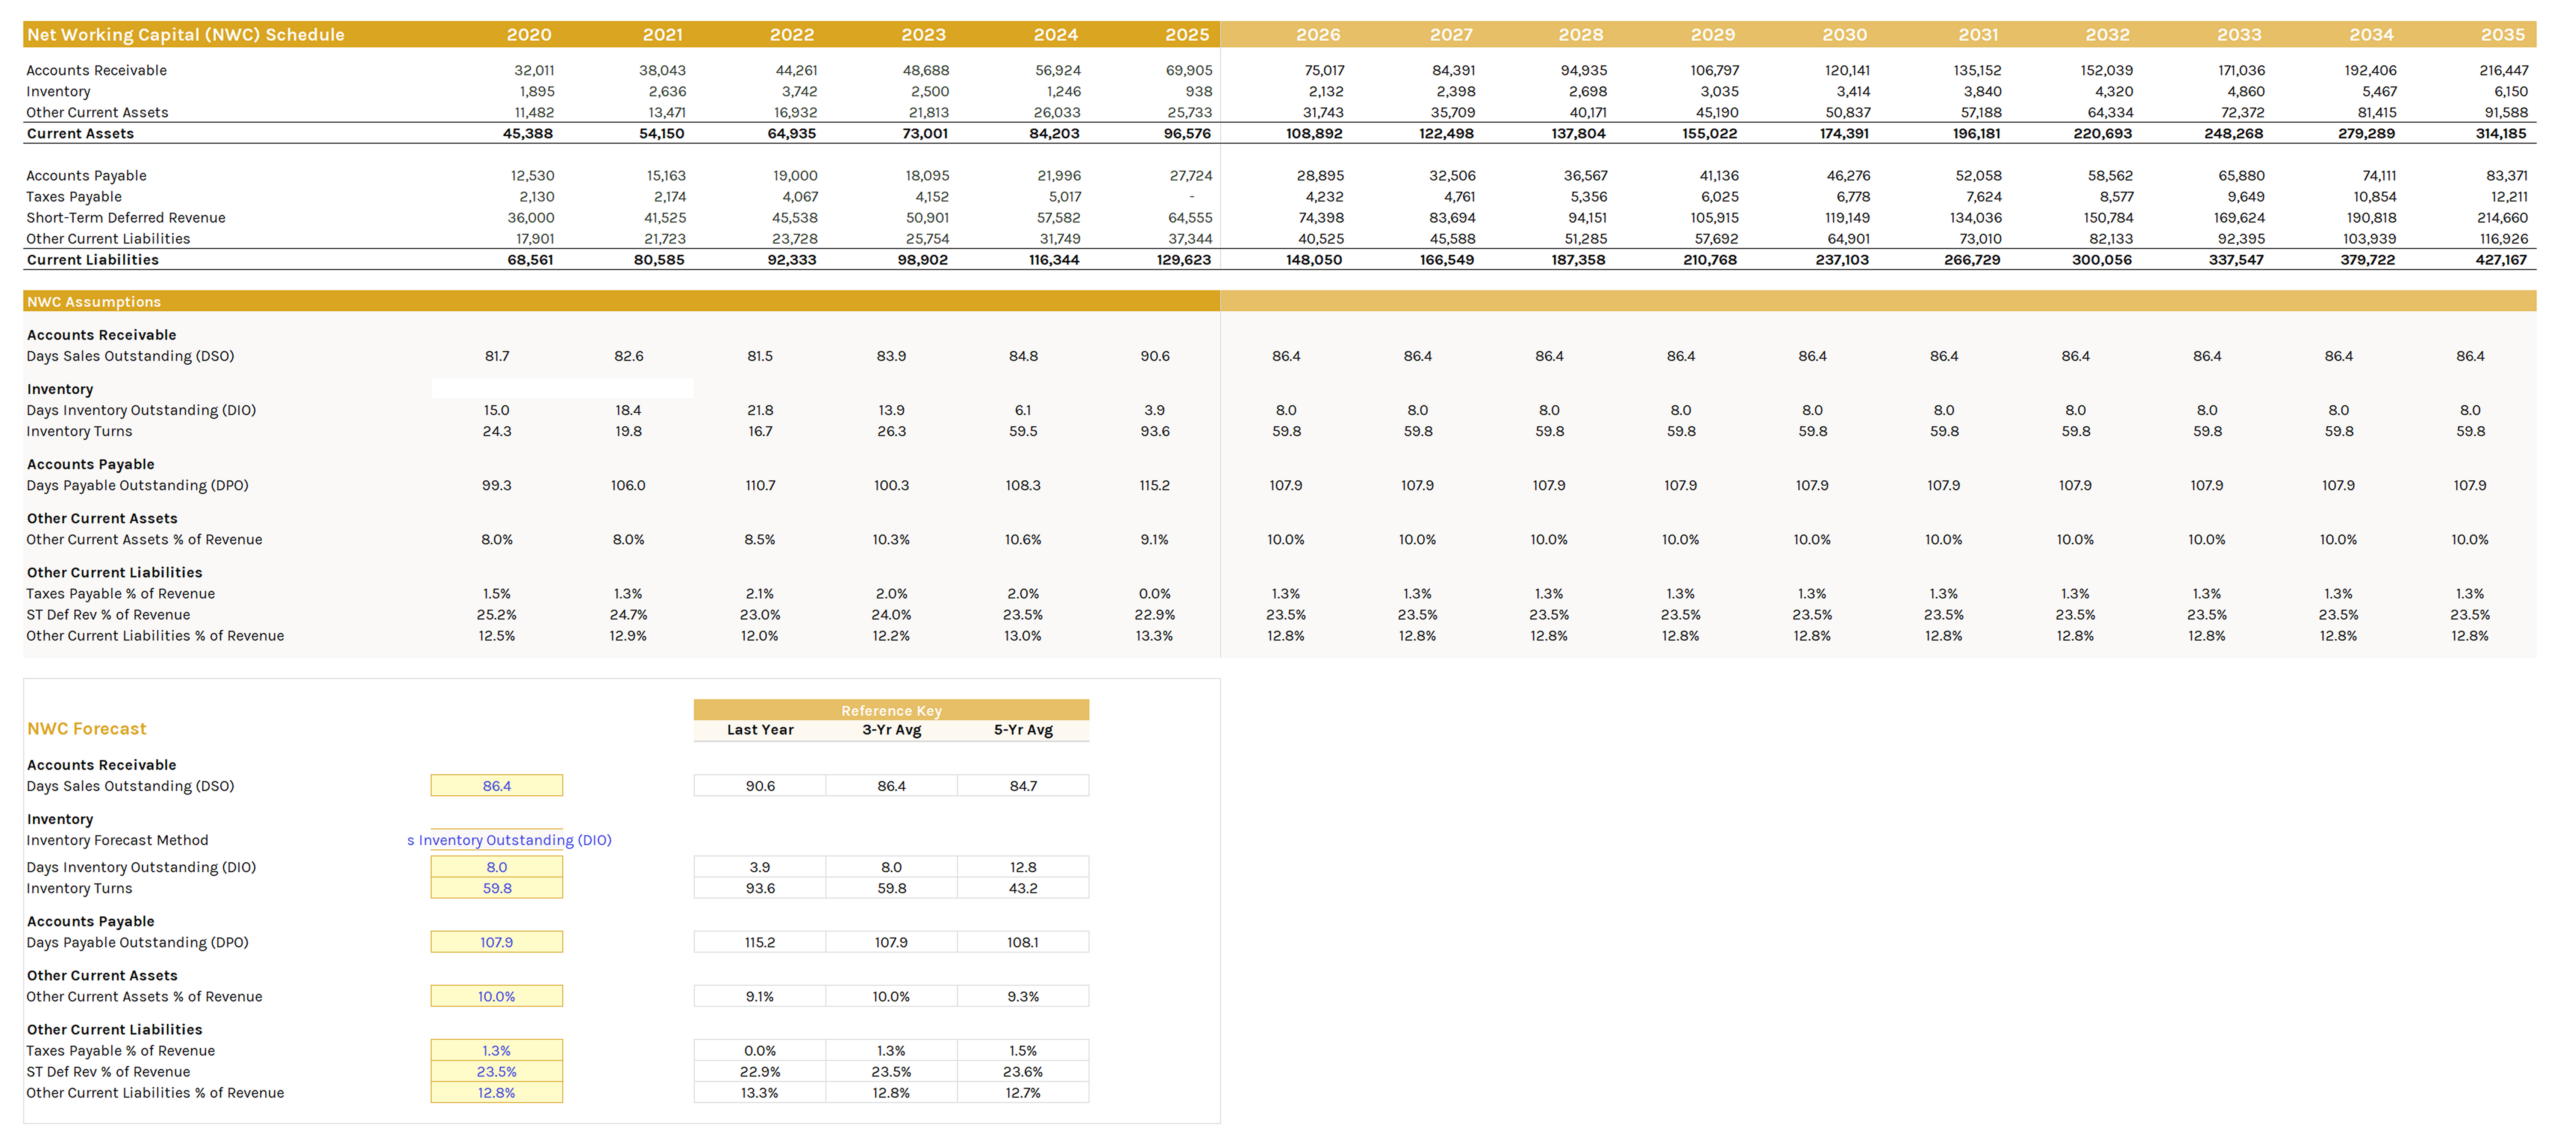
The non-cash NWC schedule tracks and forecasts short-term operating assets and liabilities.
Non-Cash NWC = Non-Cash Current Assets - Non-Interest Bearing Current Liabilities
where:
- Non-Cash Current Assets:
- Accounts Receivable (A/R): Amounts owed to the company for products or services sold on credit.
- Inventory: Value of raw materials, work in progress, and finished goods.
- Prepaid Expenses and Other Current Assets: Payments made in advance and other short-term operational assets.
- Non-Interest Bearing Current Liabilities:
- Accounts Payable (A/P): Amounts owed by the company for products or services already purchased.
- Accrued Liabilities: Expenses incurred but not yet paid.
- Other Current Liabilities: Additional short-term operational obligations.
Items Excluded From Non-Cash NWC
Items excluded from non-cash NWC (since FCFF values the entire enterprise):
- Cash and Equivalents: Cash and liquid assets convertible to cash within 90 days.
- Short-Term Investments: Securities maturing within 3 months to 1 year.
- Short-Term Debt: Obligations due within one year (short-term loans, commercial paper, current portion of long-term debt).
Impact on Free Cash Flow
Changes in non-cash NWC from year-to-year represent an annual source or use of cash for the company:
Change in Non-Cash NWC = NWCn - NWCn-1
where:
- n = most recent year
- n-1 = prior year
This relationship affects FCFF in two ways:
Increase in Non-Cash NWC → Reduces FCFF
When non-cash current assets increase by more than current liabilities, this is considered a use of cash. The company is investing more funds into items like inventory and accounts receivable, which reduces available cash flow.
Decrease in Non-Cash NWC → Increases FCFF
When non-cash current liabilities increase by more than current assets, this is considered a source of cash. The company is receiving more credit from suppliers or deferring payments, freeing up cash that would otherwise be tied up in working capital.
Accounts Receivable (A/R)
Accounts receivable refers to amounts owed to a company for its products or services sold on credit. A/R is forecasted using Days Sales Outstanding (DSO):
DSO = (A/R / Revenue) × 365
Forecast A/R = Forecast DSO × (Forecast Revenue / 365)
- Increasing DSO → Bad: Takes more time to collect payments after sale of product/service.
- Decreasing DSO → Good: Takes less time to collect payments after sale of product/service.
Inventory
Inventory refers to the value of a company's raw materials, work in progress, and finished goods. Two methods exist for forecasting inventory:
Method #1: Days Inventory Held (DIH)
DIH measures the number of days it takes a company to sell its inventory:
DIH = (Inventory / COGS) × 365
Forecast Inventory = Forecast DIH × (Forecast COGS / 365)
Method #2: Inventory Turns
Inventory turns measures the number of times a company turns over its inventory in a given year.
Inventory Turns = COGS / Inventory
Forecast Inventory = Forecast COGS / Forecast Inventory Turns
- Increasing DIH or Decreasing Inventory Turns → Bad: Indicates customers are buying less and inventory is sitting on shelves longer.
- Decreasing DIH or Increasing Inventory Turns → Good: Indicates customers are buying more and inventory is moving off shelves faster.
DIH and inventory turns are mathematical inverses of each other. Use DIH if you want to know how long inventory sits. Use inventory turns if you want to know how often inventory is sold and replaced.
Accounts Payable (A/P)
Accounts payable refers to amounts owed by a company for products or services already purchased. A/P is forecasted using Days Payable Outstanding (DPO):
DPO = (A/P / COGS) × 365
Forecast A/P = Forecast DPO × (Forecast COGS / 365)
- Increasing DPO → Bad: Takes more time for company to pay suppliers.
- Decreasing DPO → Good: Takes less time for company to pay suppliers.
While increasing DPO can be favorable for cash flow, it may strain supplier relationships. The optimal DPO balances cash flow benefits with maintaining good supplier partnerships.
Other Non-Cash NWC Items
Other non-cash NWC items, excluding A/R, Inventory, and A/P, are typically forecasted as a percentage of revenue:
Other Non-Cash NWC Items = Forecast Revenue × Historical % of Revenue
The assumption is that these items will grow proportionally with the company's operations, making percentage of revenue an appropriate forecasting metric.