

Relevant: Financial Statements Articles
Key Financial Statements (KFS) consolidates all financial statements (IS, BS, CFS) onto a single tab with supplementary calculations below each statement.
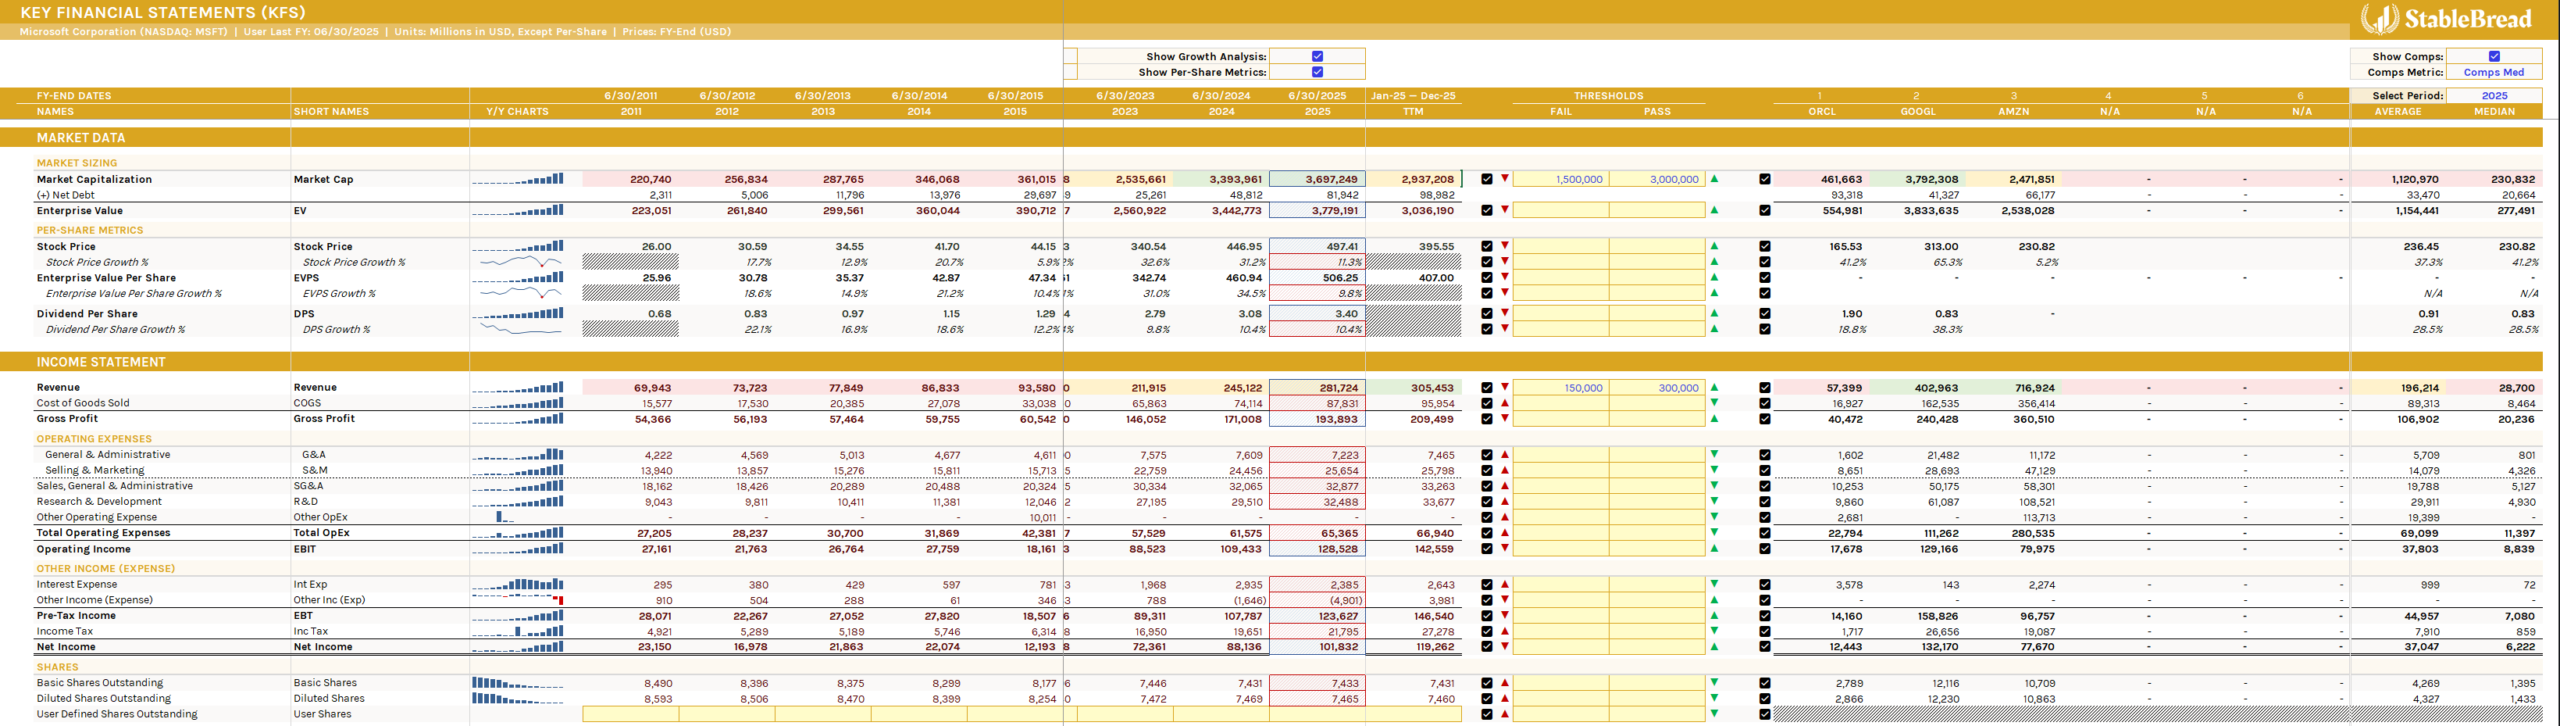
- Data coverage: Up to 15 years of annual data, last 9 quarters, TTM, and NTM estimates (manual input).
- Sparkline charts: Y/Y sparkline charts for each line item.
- Show/hide sections: Checkboxes at the top show/hide financials, common size, growth analysis, and per-share metrics.
- Per-share metrics: Available for each financial statement. Select between basic, diluted, or user-defined (requires inputting share counts on the IS). Comparables support basic or diluted only.
- Threshold pass/fail: Set thresholds for any metric. Three checkbox columns toggle conditional formatting on/off for each section: (1) company financials, (2) min/mean/median/max range (with selectable beginning and ending periods), and (3) comparables.
- Comparables comparison: Check "Show Comps," select "Comps Med" or "Comps Avg," then choose a period (last 3 FY or TTM). Company's metrics highlight blue (better) or red (worse) relative to the selected comps median/average.
Note: KFS serves as the primary data source for all calculations and models throughout the workbook.