

On June 12, 2026, SpaceX (SPCX) started trading on the Nasdaq. The night before, SpaceX had sold new shares at $135 each to investors selected by its banks, raising $75B in the biggest IPO ever.
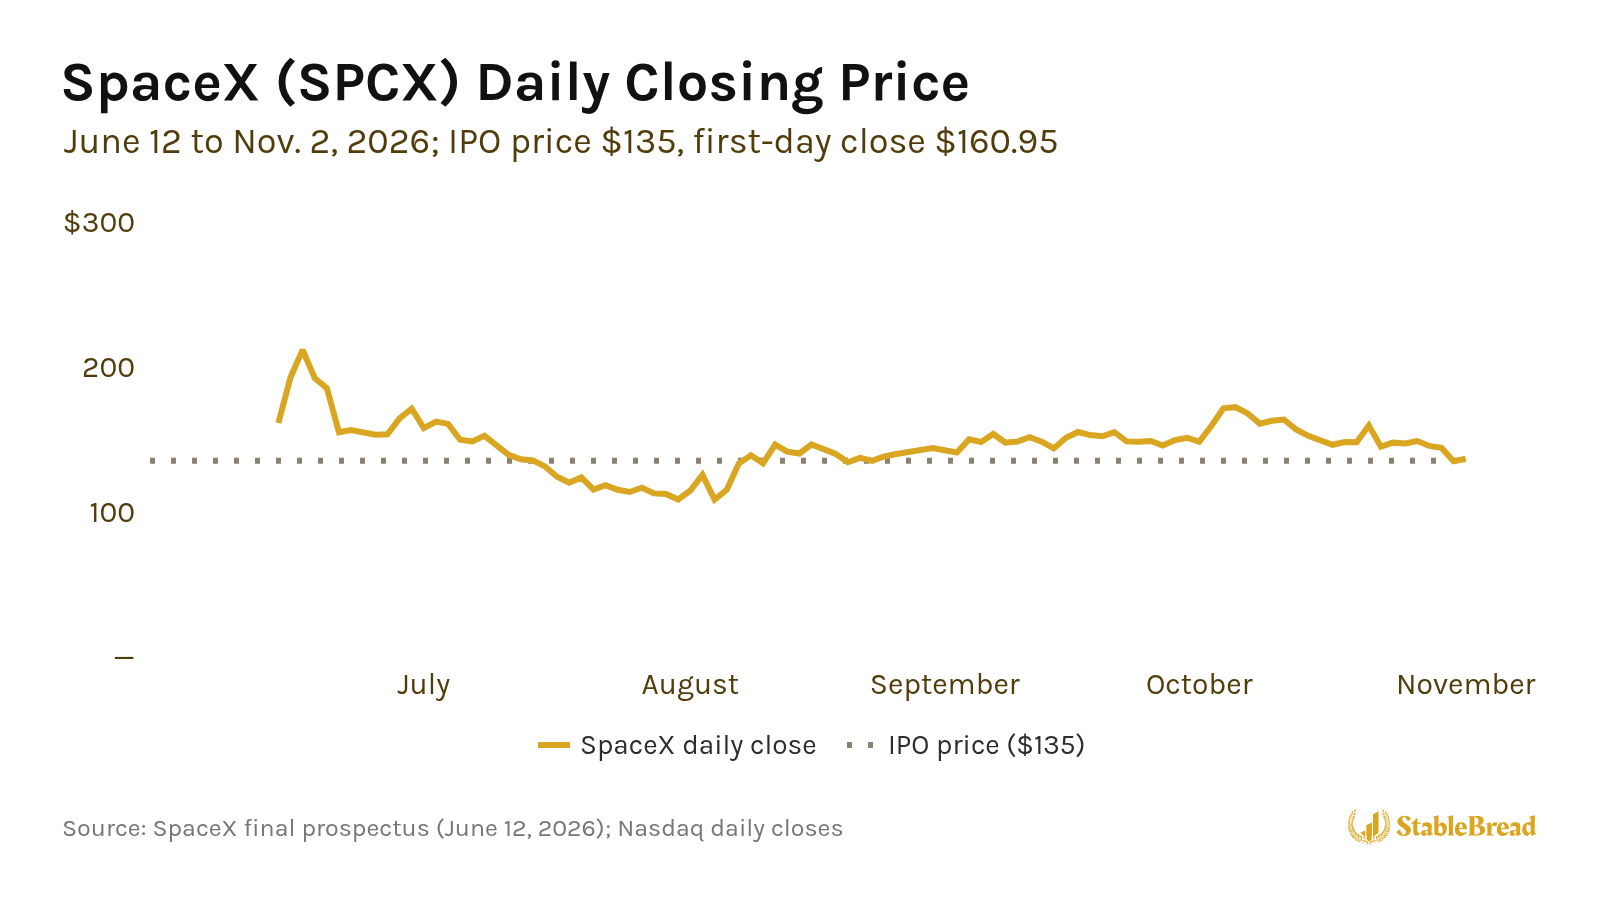
By the end of its first trading day, SpaceX’s stock closed at $160.95, up 19%. So in a single day, the investors who got shares at the IPO price gained $16.6B on paper.
If you bought SpaceX’s stock at that $160.95 close, you were down 33% by August 5, 2026, and as of November 2, 2026, it’s still 15% below that close:
SpaceX’s pattern isn’t unusual. From 1980 to 2024, investors who got shares of U.S. IPOs at the IPO price earned 36.3% over the next three years on average, according to data from Jay Ritter, a finance professor at the University of Florida.
Investors who bought the same stocks at the close of their first trading day earned 19.1%, while the total U.S. stock market returned 39.6% over the same periods:
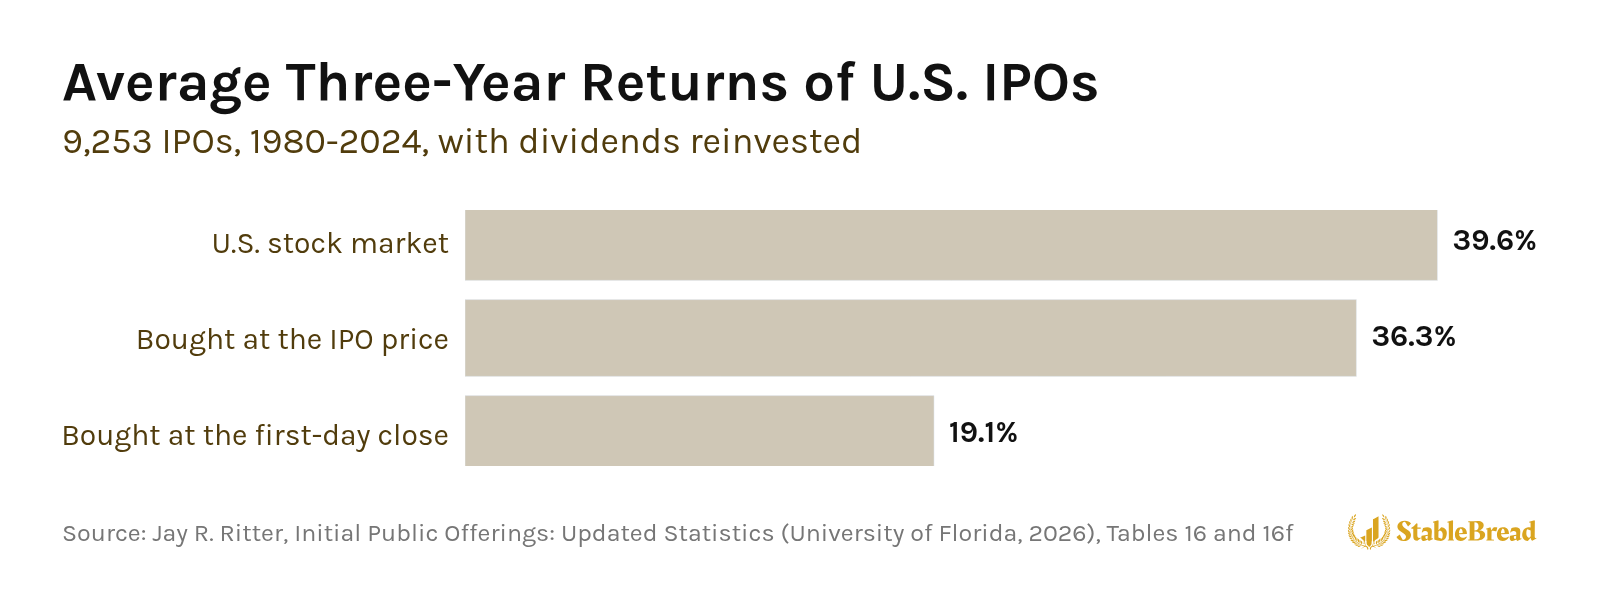
So the investors who got shares from the banks at the IPO price, mostly big funds, did almost as well as the market. Investors who bought on the open market at the end of the first trading day earned about half as much.
If a company you’ve wanted to own for years finally goes public, should you buy its stock on its first trading day? What about after its first month of trading, after six months, or after a year?
Below, I’ll walk through how an IPO works, who gets shares at the IPO price, and when companies tend to go public, then what more than 9,000 IPOs returned in the years after their first trading day, how the biggest IPOs since 2011 did, and when I’d consider buying an IPO.
How an IPO Works
An IPO, short for initial public offering, is the first time a company sells its shares to the public. The company can sell new shares to raise money, and its founders, employees, and early investors can sell some of the shares they already own.
To sell those shares, the company hires investment banks called underwriters. Together, they write what’s called a Form S-1, the filing with the SEC that describes the business, its finances, and its risks (SpaceX filed its S-1 on May 20, 2026).
That means the main document you’d read to judge an IPO is written by the company and the banks it’s paying to sell its shares.
The banks then pitch the stock to big investors like mutual funds and hedge funds, which is called a roadshow, and collect their orders. The night before its first trading day, the company and its banks set the IPO price, and the banks decide who gets the shares.
The next day, the stock begins trading, and for most individual investors, that’s the first chance to buy, at whatever price the stock trades for.
First-Day Pop
The jump from the IPO price to the first day’s close is called the first-day pop. Since 1980, U.S. IPOs have popped 19% on average, and in 1999, during the dot-com bubble, the average was 71%:
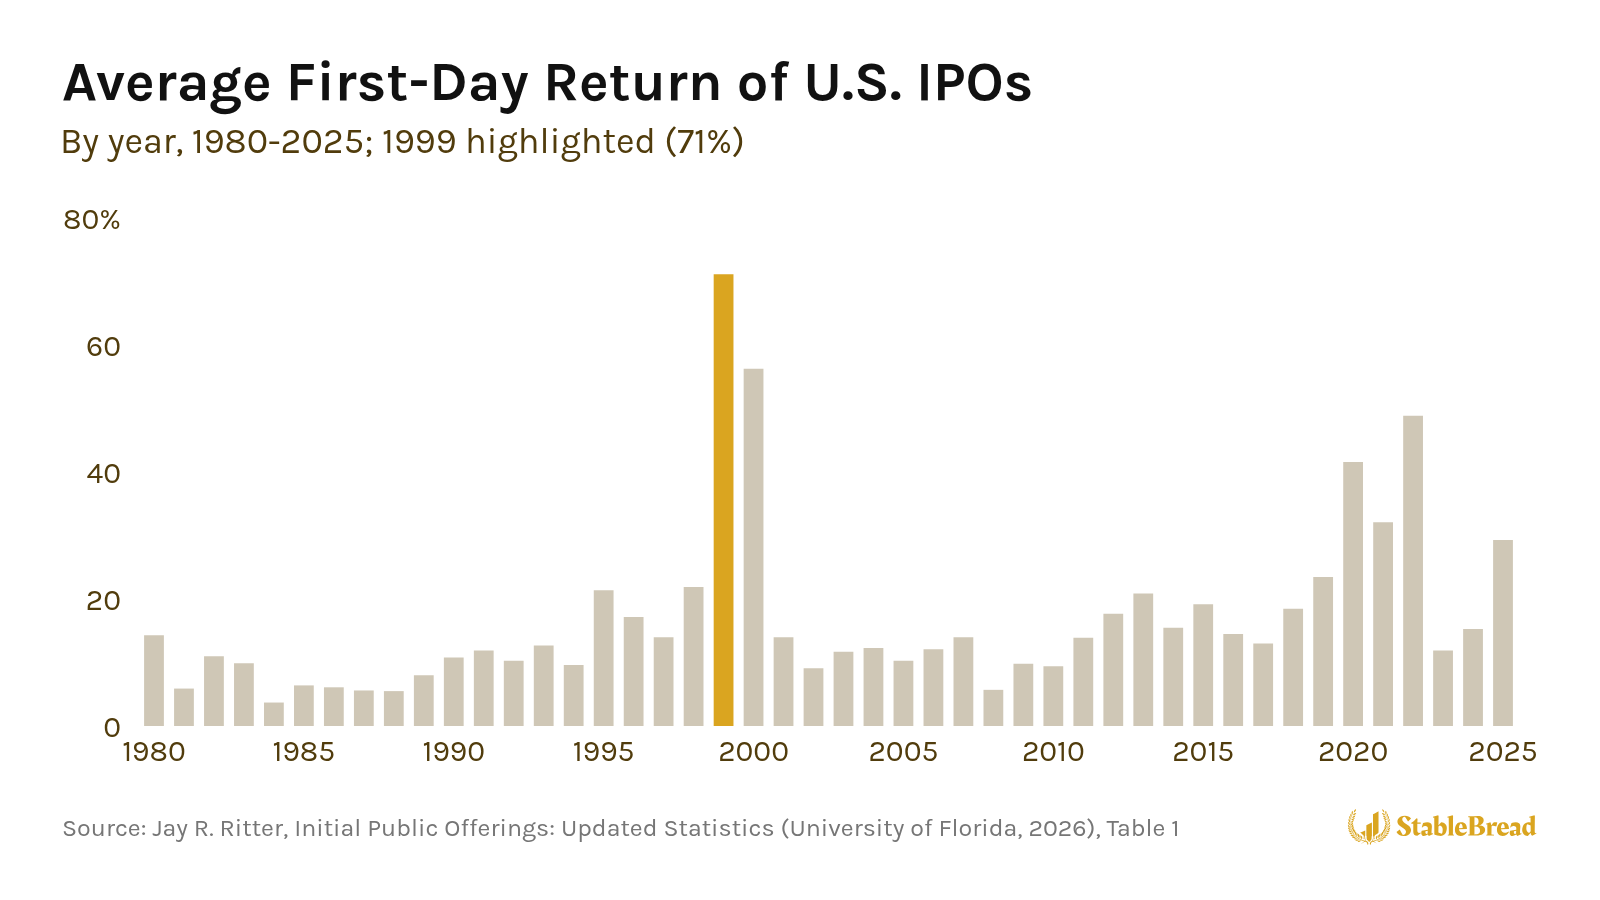
Added up, those first-day gains come to $250B, which economists call money left on the table. Economists use that name because the $250B is how much more the companies would have raised by selling their shares at the first day’s close.
Lockup Period
Founders, employees, and early investors also usually agree not to sell their shares for 180 days after the IPO, which is called the lockup period.
By the time most individual investors can buy an IPO, everyone else already owns shares. In Ritter’s data, the median company going public since 2001 has been 11 years old, so its founders and early investors have usually owned theirs for years. The banks’ clients bought theirs the night before, at the IPO price.
Get Our 50-Question Stock Analysis Checklist!
After researching hundreds of stocks, we built this 50-question checklist to guide your analysis and help you avoid costly mistakes.
Download ChecklistWho Gets Shares at the IPO Price
Banks don’t publish who gets the shares they sell at the IPO price. But in a 2002 study, three finance professors, Reena Aggarwal, Nagpurnanand Prabhala, and Manju Puri, used allocation records the SEC had collected from nine banks covering 174 IPOs from 1997 and 1998.
The three professors found that institutions like mutual funds and hedge funds got 73% of the shares on average. In the IPOs that rose more than 40% on their first trading day, institutions got 78%, vs. 60% in the IPOs that fell.
One reason is that those institutions are also the banks’ trading clients. In a 2018 study of 220 IPOs in Europe, the Middle East, and Africa from 2010 to 2015, Tim Jenkinson, Howard Jones, and Felix Suntheim found that the investors who paid a bank more in trading commissions got more of its IPO shares.
Winner’s Curse
Individual investors also face what’s called the winner’s curse. In a 1986 paper, economist Kevin Rock explained that when an IPO looks cheap, big investors pile in and small orders get cut back.
When an IPO looks expensive, the big investors stay away, and small investors get every share they ask for.
Retail IPO Programs
Brokers like Robinhood and SoFi have also started offering some IPO shares to their customers at the IPO price. SpaceX sent ~20% of its shares to individual investors, according to Bloomberg, but orders were cut back sharply.
CNBC reported that one Robinhood customer asked for 1,000 shares and got only 17.
The IPOs those programs offer have also tended to do worse. In a 2025 working paper, four finance researchers, David Gempesaw, Joseph Henry, Kevin Pisciotta, and Han Xiao, found that those IPOs trailed other IPOs from the same time by ~20 percentage points in their first year.
One reason the researchers found is that those IPOs were priced higher relative to their earnings. So the IPOs individual investors get the most shares of tend to be the worst ones.
Related: Why Retail Investors Have Advantages Over Professionals
When Companies Go Public
Companies also decide when to go public, and they tend to do so after stocks have already risen. In the U.S., 856 companies went public in 1999 and 2000 during the dot-com bubble. In 2008, during the financial crisis, only 21 did.
Then in 2021, during the rally after the COVID crash, 311 companies went public, the most since 2000.
IPO Waves
Economists call bursts of companies going public IPO waves. A 2005 study by Ľuboš Pástor and Pietro Veronesi, two finance professors at the University of Chicago, found that from 1960 to 2002, IPO waves tended to come after the stock market had gone up.
I checked whether that’s still true with Ritter’s monthly counts from 1980 to 2025. After the S&P 500 had fallen over the previous year, an average of 6 companies went public each month. After it had risen more than 30%, 5x as many did:
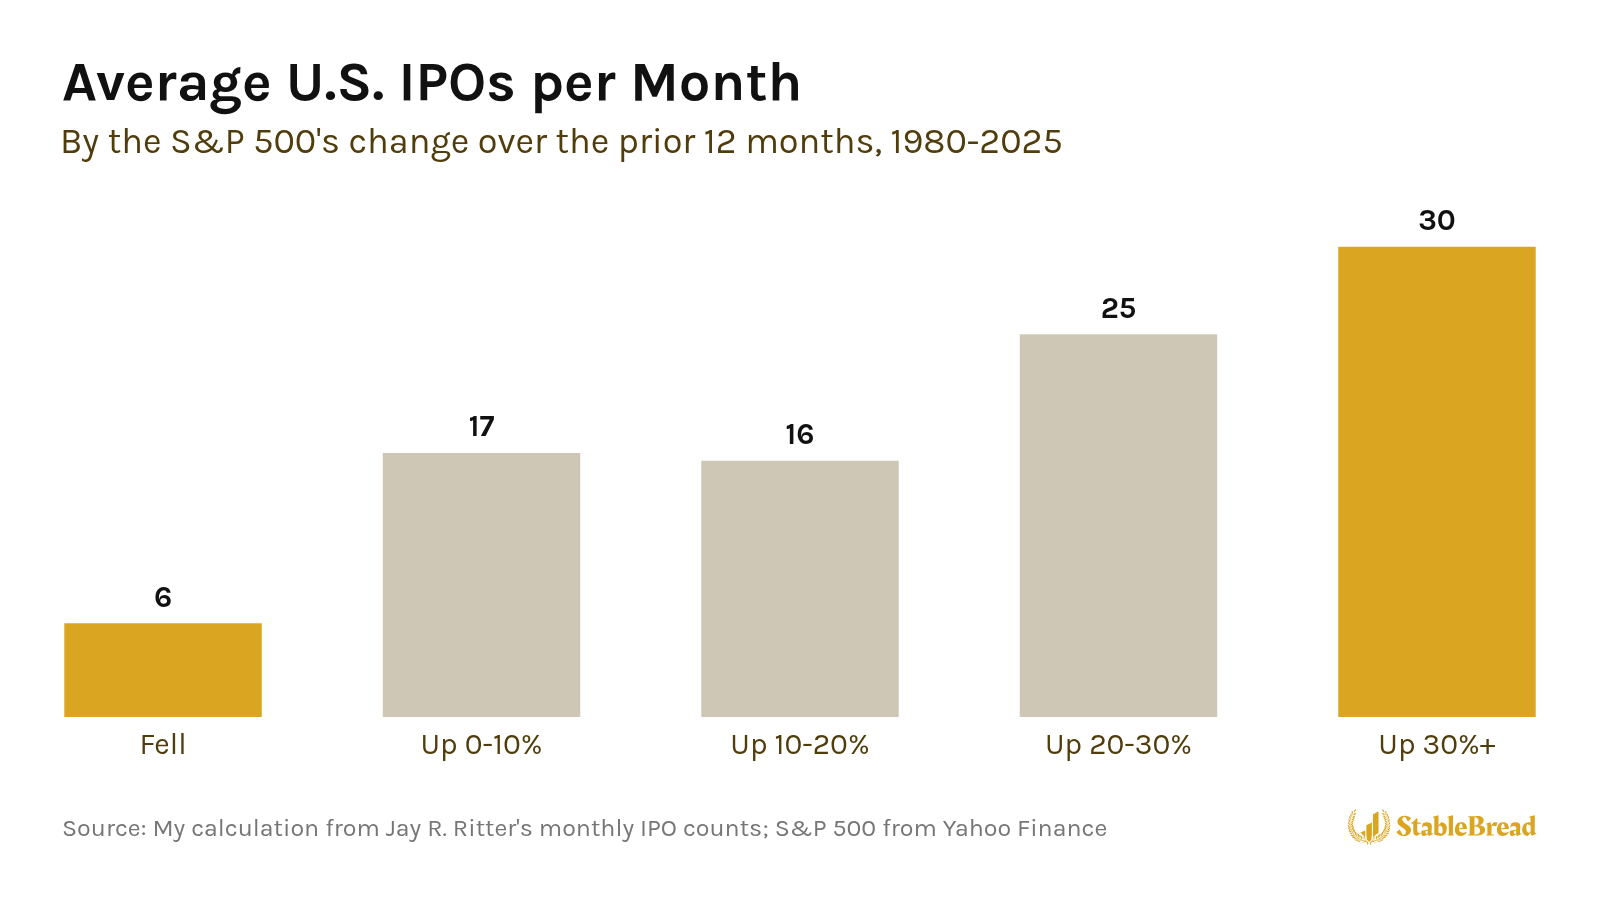
The same has happened in 2026. In the 12 months before SpaceX’s IPO, the S&P 500 rose 23%, and through October 2026, U.S. IPOs raised $148.6B, already more than the $142.4B they raised in all of 2021, according to Renaissance Capital, an IPO research firm.
Warren Buffett described why that’s a problem for buyers at Berkshire Hathaway’s 2004 annual meeting:
“The seller decides when to come to market in most cases. And they don’t pick a time necessarily that’s good for you.”
— Warren Buffett, 2004 Berkshire Hathaway Annual Meeting
Busy Years vs. Quiet Years
IPOs from busy years have done worse than IPOs from quiet ones. In Ritter’s data, the IPOs from the 10 busiest years since 1980 trailed the market by 27% over their first three years on average, while the IPOs from the 10 quietest years beat it by 4%:
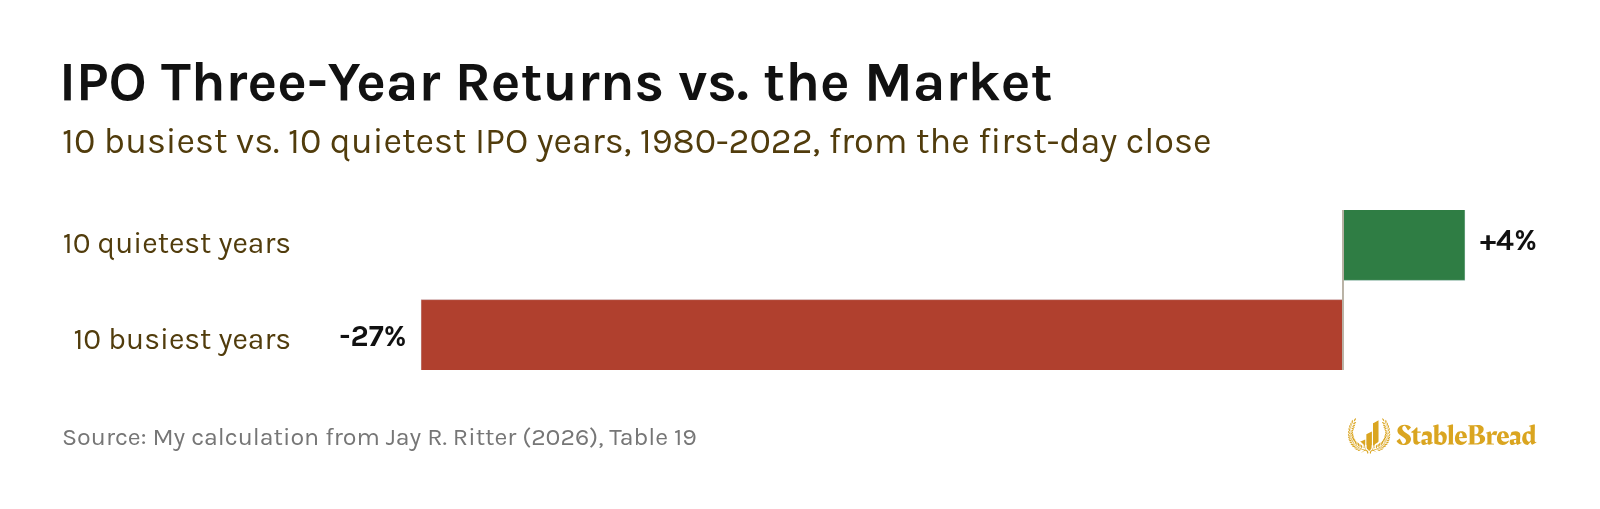
So historically, IPOs have done worst in the years when the most companies went public.
Related: How to Identify an Overvalued Stock Market
Years After the First Trading Day
Ritter compared how IPOs did in each stretch after their first trading day with established companies of the same size and valuation:
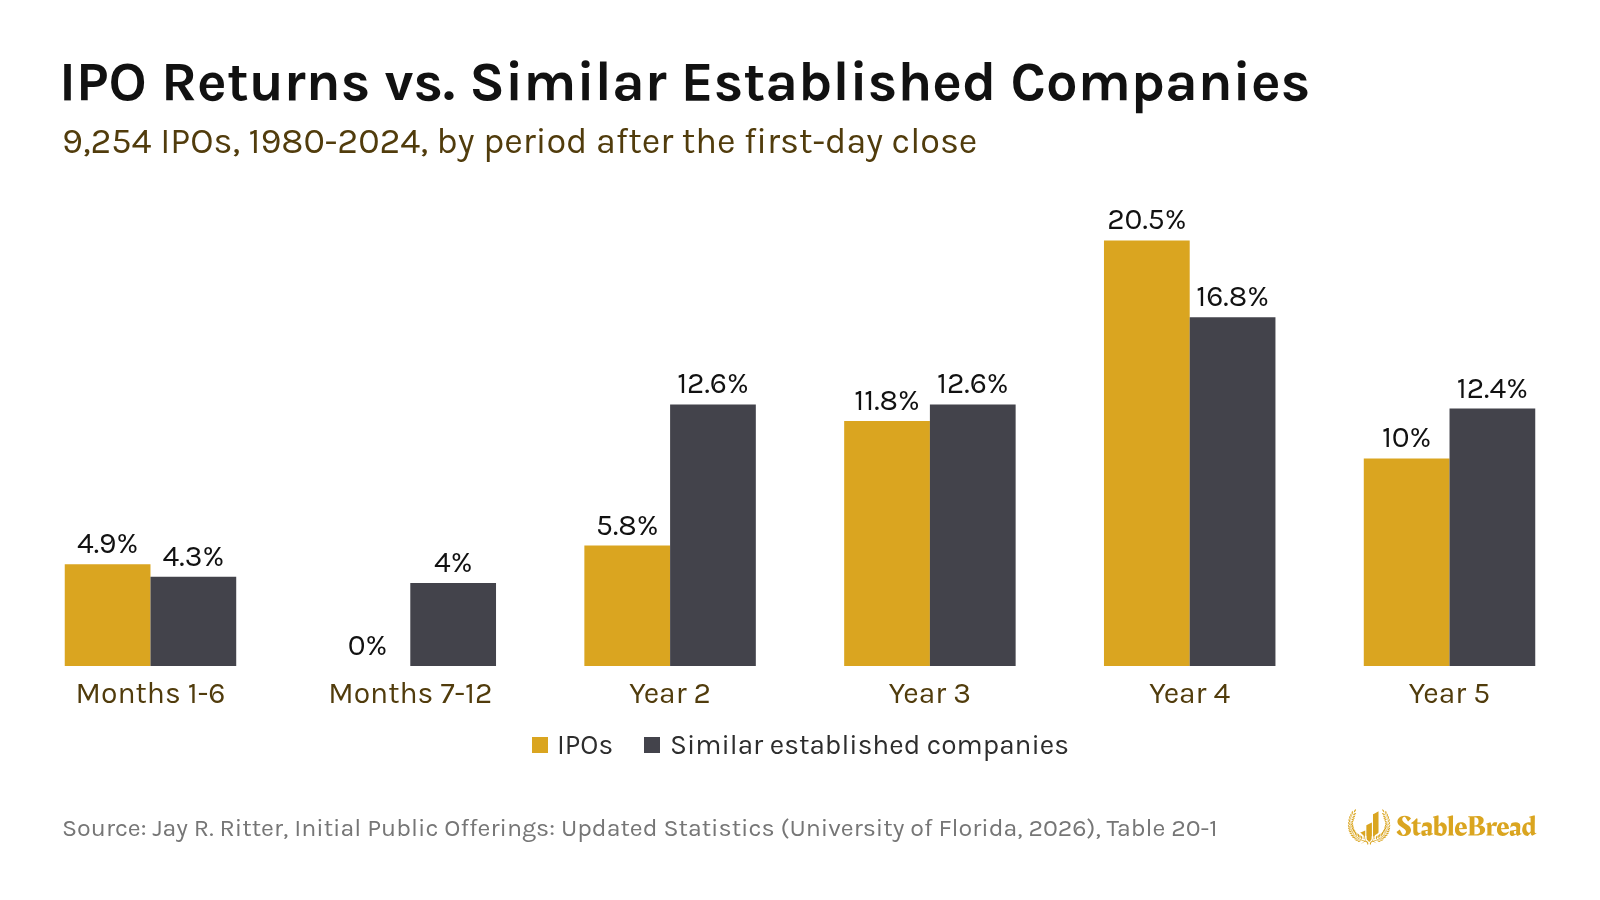
In their first six months, his IPOs from 1980 to 2024 kept up, returning 4.9% vs. 4.3% for those companies. In the next six months, the IPOs returned nothing while those companies returned 4.0%, and in their second year, 5.8% vs. 12.6%.
From their third year on, the IPOs did about as well as those companies on average.
When the Lockup Ends
The lockup usually ends right around the six-month mark. In a 2001 study of 1,948 lockups, Laura Field and Gordon Hanka found that stocks trailed the market by 1.5% on average over the three days around the lockup’s end, while trading volume rose 40% for good.
Three-Year Returns
Ritter also measured what 9,195 IPOs from 1975 to 2021 returned over the full three years after the close of their first trading day, with dividends reinvested:
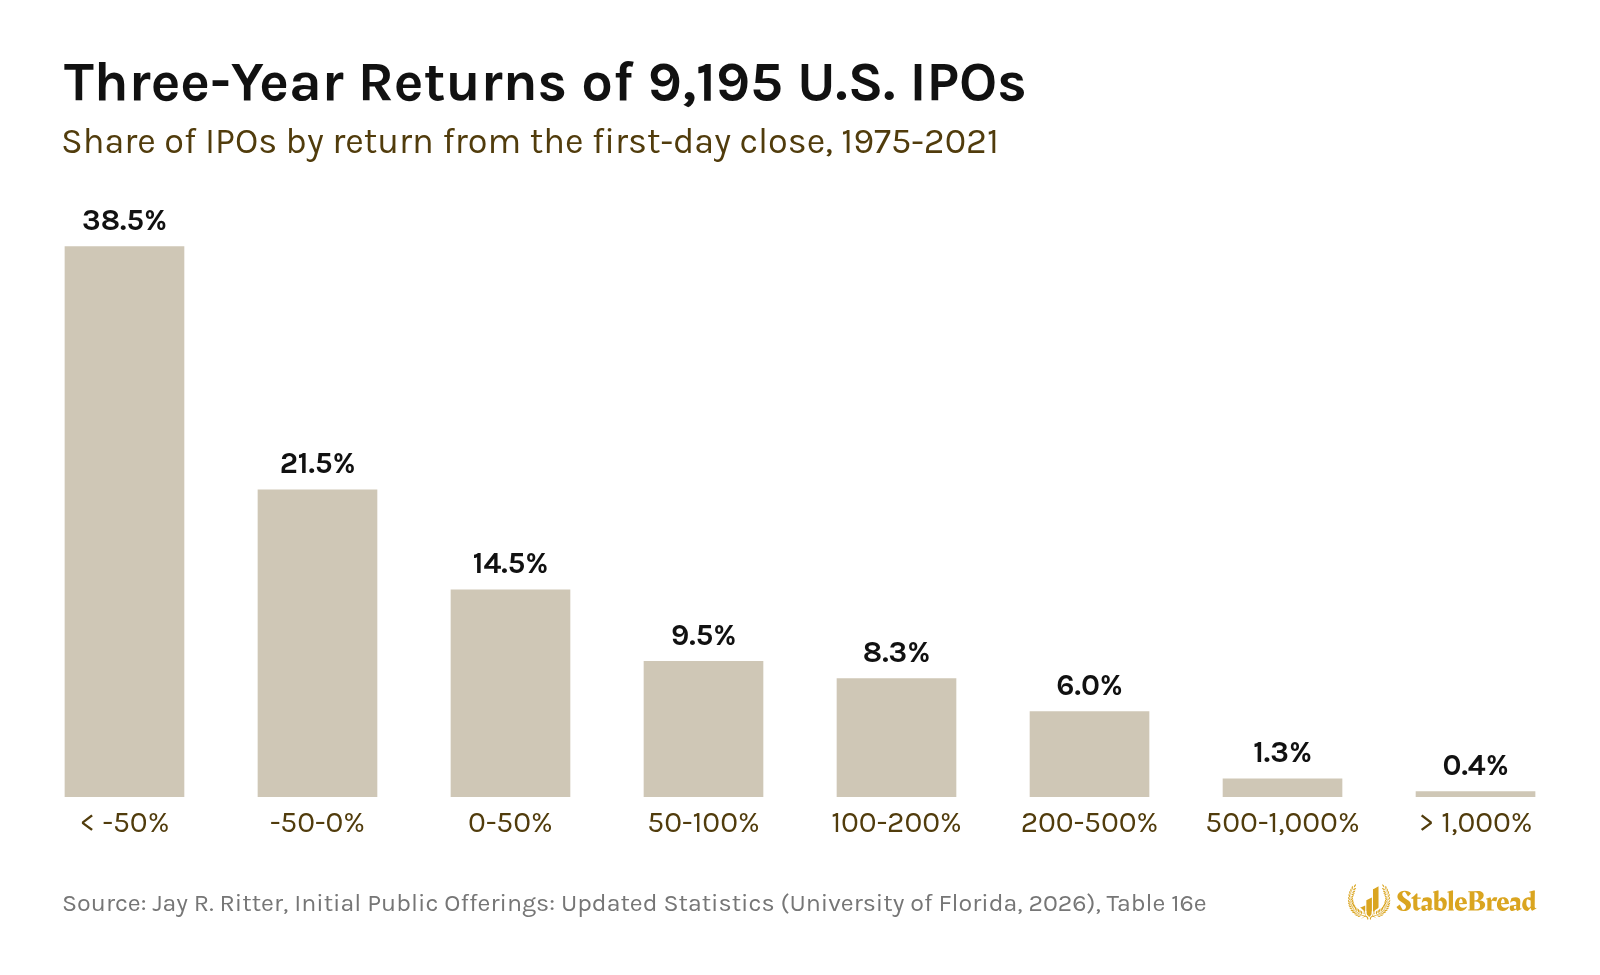
Of those IPOs, 60% lost money, and 38.5% lost more than half. On the other hand, 16% more than doubled, and 39 of them (~1 in 240) rose more than 11-fold. Still, the median IPO lost 25.7%.
Small and Money-Losing Companies
Among IPOs, small companies did the worst over their first three years. Ritter grouped the IPOs by their sales over the year before going public and by whether they were profitable.
The ones with less than $100M in sales that were losing money trailed the market by 40.9% over three years on average, and the profitable ones by 25.9%. The ones with more than $100M in sales trailed the market by only ~3%, whether they were profitable or not.
More of the companies going public are also losing money now. In the 1980s, 19% of the companies that went public had lost money over the previous year, and that share has averaged 70% since 2011.
So over the three years after their first trading day, IPOs have trailed the market on average, the typical one has lost money, and the small ones losing money have done the worst. However, most of Ritter’s IPOs were small companies.
How the Biggest IPOs Did
To see how the biggest, best-known IPOs did, I selected the 23 largest IPOs on U.S. exchanges from 2011 to 2025 with daily prices to measure, from Facebook and Alibaba to Rivian and Arm, and measured each one from the close of its first trading day, just like Ritter does.
All 23 closed below that price at some point in their first year:
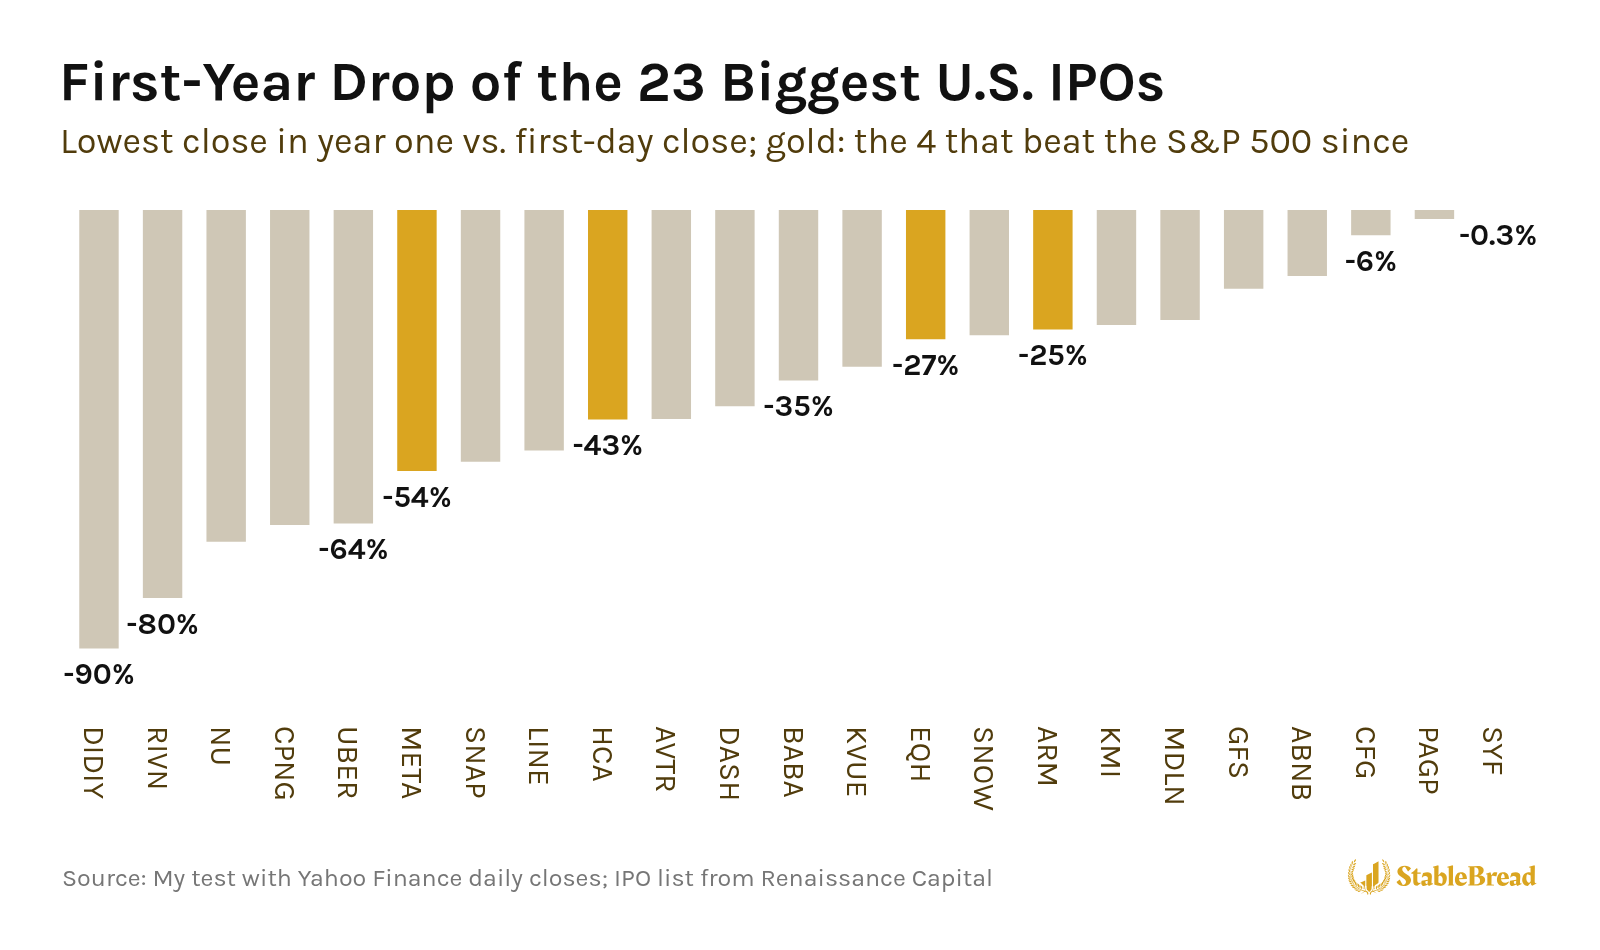
At its lowest, the median one was 35% below its first-day close, and 18 of them fell below the IPO price as well. For example, Uber (UBER) fell 64% in its first year, and Rivian (RIVN) fell 80%.
Biggest IPOs of 2026
All 14 U.S. IPOs that raised $1B or more in 2026 have closed below their first-day price at some point, and 12 of them were still below it as of November 2, 2026.
Against the S&P 500
Over the longer run, only 7 of the 21 biggest IPOs from 2011 to 2025 that are old enough to measure beat the S&P 500’s total return over their first three years.
As of November 2, 2026, only 4 of the 23 have beaten the S&P 500 since their first trading day. Those four are Meta (META), the hospital operator HCA Healthcare (HCA), the chip designer Arm (ARM), and the insurer Equitable (EQH). Even those four fell 25-54% below their first-day close in their first year.
Waiting to Buy
Waiting a few months to buy the 23 biggest IPOs from 2011 to 2025 would usually have gotten you a lower price. A month after their first trading day, 11 of the 23 were below their first-day close. Six months after, 15 were, and a year after, the median one was 15% below that close.
However, the lower price didn’t help most of them beat the market. Bought a month, six months, or a year later, only 4 have beaten the S&P 500 since, the same number as from the first trading day.
Even if you’d bought each one at its lowest close of its first year, only 8 of the 23 would have beaten the S&P 500 since.
So for the biggest IPOs, a price below the first-day close almost always came along within the first year. But even that lower price wasn’t enough for most of them to beat the market.
When I’d Buy an IPO
I wouldn’t buy a stock on its first trading day. Unless you’re making a quick trade in its first few weeks, which has been a coin flip anyway, there’s no reason in the data to buy that early.
On an IPO’s first trading day, you’re the last one in. The insiders choose when to go public, usually after stocks have already risen, and the company and its banks wrote the S-1 you’d use to judge the business. Everyone else also got their shares before you could buy, usually for less than you’ll pay.
Instead, I’d wait at least until the lockup ends and the company has reported a few quarters as a public company. By then, the insiders have had a chance to sell, and you can judge the business by its results as a public company, not just the numbers in its S-1.
I’d also be more careful with small companies that are losing money, the group that did the worst in Ritter’s data.
If I still wanted to own a company early, I’d buy a small position at first and add to it over its first two years, instead of buying a full position on its first trading day. In Ritter’s data, IPOs fell furthest behind similar companies in their second six months and their second year.
