

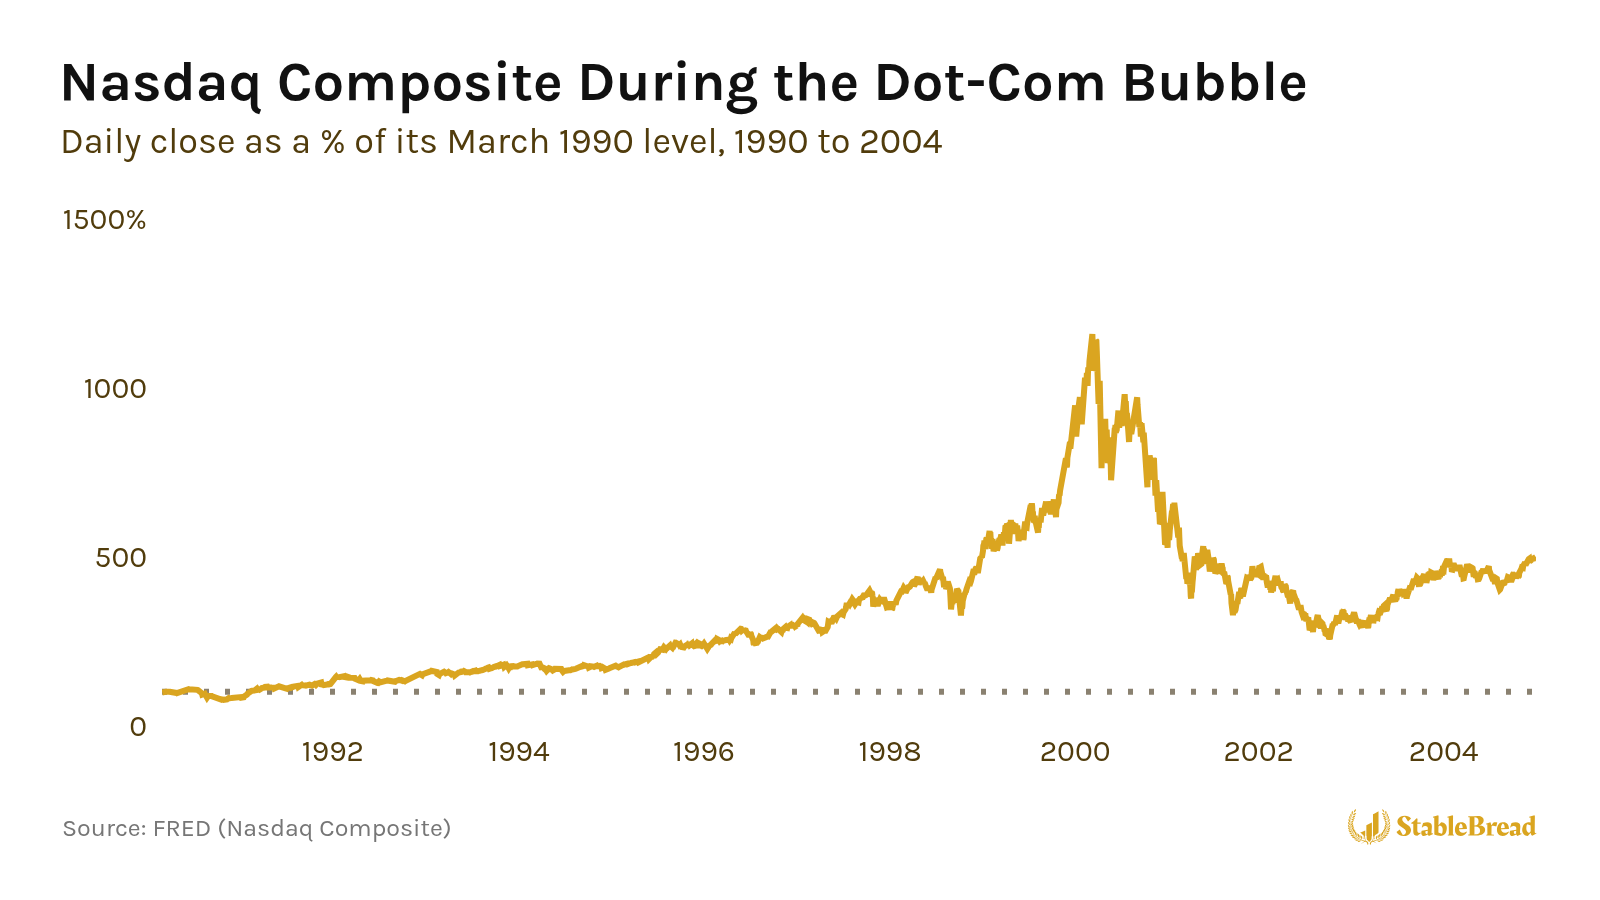
From March 1990 to its peak on March 10, 2000, the Nasdaq rose more than 11-fold. Then it lost 78% by October 2002.
Yet the recession that followed lasted only eight months, and U.S. GDP still grew in 2001.
Compare that with the U.S. housing bubble, which peaked six years later. Home prices fell 27% from their 2006 peak, far less than the Nasdaq’s 78%, but the economy shrank 4.3% in the recession that followed, its biggest drop since World War II.
The housing bust hit the banks directly. The banks had made the home loans, and many held securities built from those loans, so when home prices fell and borrowers stopped paying, the losses landed on the banks. From 2008 to 2012, 465 U.S. banks failed, and the rest cut back on lending.
The dot-com crash was different. Banks owned few tech stocks, so they kept lending through the downturn.
So how can you tell when a boom is turning into a bubble, and how much damage it could do when it pops?
To answer that, I read William Quinn and John D. Turner’s “Boom and Bust: A Global History of Financial Bubbles” (2020), which introduces the “bubble triangle.”
A bubble needs three conditions: (1) assets that are easy to trade, (2) plenty of money and credit, and (3) widespread speculation. Then something sets it off, usually a new technology or a government policy.
When a bubble bursts, the damage depends on how big it got and how tied it is to the rest of the economy, most often through banks. Across 300 years of bubbles, the ones started by a government policy and fueled by bank loans did the most damage, and all four such bubbles in their book hurt their economies for years.
As of October 2026, the AI boom has all three sides of the triangle, and a growing share of it runs on borrowed money. Amazon (AMZN), Alphabet (GOOGL), Meta (META), and Oracle (ORCL) sold ~$194B of bonds in 2026 through early July, already more than in all of 2025. Margin debt, the money investors borrow from their brokers to buy stocks, also hit a record $1.5T in June 2026.
If you own tech stocks, or an S&P 500 index fund that’s now ~40% tech, the bubble triangle can help you judge whether the AI boom still has room to grow, and how far the damage could spread if it ends.
Below, I’ll walk through how the bubble triangle works, how it explains the dot-com bubble, which bubbles do the most damage, and how the AI boom measures up on each side of the triangle.
Bubble Triangle
Quinn and Turner, two economic historians at Queen’s University Belfast, define a bubble as a steep rise in an asset’s price, followed by a steep fall. For the major bubbles in their book, prices at least doubled in under three years, then fell by at least half within three years, while new companies or securities were being sold to the public.
Quinn and Turner’s list has 12 major bubbles, from the Mississippi and South Sea bubbles of 1720 to China’s stock bubbles in 2007 and 2015. Six of them, so half, were followed by a financial crisis.
To explain why those 12 happened when they did, Quinn and Turner propose thinking of financial bubbles like fires, which are self-perpetuating and difficult to control once started.
Just as the fire triangle consists of oxygen, fuel, and heat, the bubble triangle requires (1) marketability, (2) money/credit, and (3) speculation:

Once all three are there, a single spark can set it off, and that spark comes from a new technology or a government policy.
Marketability: The Oxygen
Marketability represents how easily an asset can be bought and sold. Like oxygen for fire, it’s always present to some extent and essential for markets to function, but too much creates danger. For example, you can sell shares of Apple in your brokerage account in seconds, but selling a house can take months.
Quinn and Turner identify five key factors that determine an asset’s marketability:
- Legality: Assets must be legally tradeable.
- Divisibility: Ability to buy small portions (one share vs. an entire house).
- Transaction costs: Lower costs encourage more trading.
- Finding counterparties: How easily buyers and sellers can connect.
- Digital transferability: Instant trading from anywhere vs. physical delivery.
The authors note that bubbles frequently follow financial innovations that improve one or more of these factors.
During the subprime bubble of the 2000s, mortgage-backed securities transformed individual home loans that banks previously held to maturity into tradeable securities that could be bought and sold like stocks. This innovation improved both divisibility (investors could buy portions of mortgage pools) and the ease of finding counterparties (through liquid secondary markets).
Online trading platforms have similarly revolutionized marketability by reducing or eliminating transaction costs and enabling digital transferability, allowing millions of investors to trade from home at any hour.
Each innovation made assets that were previously difficult to trade suddenly easy to buy and sell, creating the conditions for speculation to flourish.
“Just as one would not keep oxygen tanks beside an open fire, there are times and places where too much marketability can be dangerous.”
— Quinn and Turner, Boom and Bust
Money and Credit: The Fuel
Bubbles require abundant capital for investment, making them much more likely when money and credit flow freely, whether it’s investors’ own money or borrowed money. Low interest rates and loose lending standards stimulate bubbles through two mechanisms.
First, investors can purchase bubble assets with borrowed money, driving prices higher.
Since lenders and borrowers are both using other people’s money, neither carries the full loss if the bet fails, so both take greater risks. The more credit expands, the higher bubble assets rise, until investors start selling to repay loans and trigger a collapse.
Second, low rates on safe assets push investors to “reach for yield” in riskier investments.
If government bonds or bank deposits pay minimal returns, investors chase higher yields in stocks, real estate, or other volatile assets regardless of risk.
When banking systems become exposed to bubble assets, the economic damage multiplies. Banks that fail can trigger chains of bankruptcies affecting businesses and households with no connection to the original bubble, spreading financial contagion throughout the economy.
Related: Why Investors Should Avoid Bank Stocks
Speculation: The Heat
Speculation means buying assets solely to sell them later at higher prices, providing the heat that sustains bubbles.
While some speculation always exists, bubbles see masses of first-time investors becoming momentum traders, buying when prices rise and selling when they fall.
Just as fire generates its own heat, speculation becomes self-reinforcing. Early speculators profit spectacularly, attracting more speculative money and driving further price increases.
Experienced traders and institutional investors take advantage of this momentum by knowingly buying overpriced assets, planning to sell to “a greater fool” in what traders call “riding the bubble.”
Speculation intensifies when investors face limited downside risk.
Quinn and Turner identify three common scenarios where losses are capped while gains remain unlimited:
- Limited liability: Company shareholders can only lose their initial investment.
- Poor incentive structures: Fund managers get bonuses for gains but don’t share losses.
- Minimal default costs: Borrowers in some markets can walk away from underwater mortgages without further obligation.
Short selling could theoretically cool speculation, but it’s often restricted, expensive, or extremely risky since potential losses are unlimited if prices keep rising.
Spark: Technology or Politics
Quinn and Turner explain that bubbles need a spark to ignite, which can come from either technological innovation or government policy.
Railways in the 1840s, bicycles in the 1890s, and the internet in the 1990s were technology sparks. The first major bubbles, in France and Britain in 1720, were set off by government schemes to reduce public debt.
Dot-Com Bubble
The dot-com bubble demonstrated what happens when all three elements of the bubble triangle reach extreme levels simultaneously.
From March 1990 to its peak on March 10, 2000, the Nasdaq rose more than 11-fold, with technology shares reaching valuations that implied “an implausible rate of growth in profits”:
For the dot-com bubble, the spark was the internet’s transformation of computing from standalone machines into a global network where each additional user made the system more valuable. The number of people online worldwide grew from 14 million in 1993 to 281 million in 1999.
Netscape, the company behind the most popular early web browser, established the new approach with its August 1995 IPO. Netscape went public before turning a profit, used the offering as a marketing event, and saw its stock more than double on its first day, from its $28 IPO price to a $58.25 close.
This became the standard playbook. The median company going public in 1999 and 2000 was 5 years old, vs. 9 years from 1990 to 1998. In 1999, the average IPO jumped 71% on its first day of trading, vs. ~15% from 1990 to 1998.
All three sides of the bubble triangle intensified throughout the 1990s.
Marketability reached unprecedented levels:
- The average commission at New York Stock Exchange brokers fell from 0.9% of a trade in the mid-1970s to 0.1% in 2000.
- Electronic trading networks handled 30% of stock trades by 2000 (up from 3% in 1993).
- There were 9.7 million online brokerage accounts in the U.S. by 1999, and brokers had opened after-hours trading to individual investors.
Money and credit flowed abundantly:
- After the 1987 crash, Fed chair Alan Greenspan’s quick response led many investors to believe the Fed would cut rates to cushion any big drop, which became known as the “Greenspan put.”
- The Fed then cut rates three times in the fall of 1998, just as the bubble was building, which encouraged more investors to reach for yield.
- Margin debt nearly tripled, from $103B in January 1997 to $300B in March 2000.
- Household debt rose from 60% to 70% of GDP during the decade.
Speculation became rampant:
- Nasdaq’s turnover ratio (the shares traded in a year as a share of all shares listed) jumped from 88% in 1990 to 221% in 1999, so the average Nasdaq share changed hands more than twice in 1999.
- 54% of investors admitted holding stocks they believed overvalued, expecting to sell at higher prices.
- Insiders sold 23x more shares than they bought in the month before the peak.
These conditions were sustained by new era narratives that justified astronomical valuations.
For instance, authors published books like “Dow 36,000” arguing the index would quickly triple, while Wall Street analysts all but stopped telling investors to sell. Analysts’ “sell” ratings dropped from 9% of all ratings in 1989 to just 1% in late 1999.
The Nasdaq peaked on March 10, 2000, then fell 25% in a single week that April, still its worst week on record. By October 2002, it had lost 78%.
Internet stocks gave back their entire 1,000% gains within months. The AOL-Time Warner merger alone destroyed $99B in value, later called “the biggest mistake in corporate history.”
Yet the economic damage proved surprisingly limited. The 2001 recession lasted only eight months, from March to November 2001, and GDP still grew 1% for the year.
One reason is that banks held few tech stocks. A 2011 study in the Journal of Finance found that tech stocks never made up more than 4% of banks’ stock portfolios during the bubble, less than at any other type of institutional investor, so banks kept lending after the crash.
Quinn and Turner even argue the dot-com bubble may have done more good than harm. The bubble sent money to the most innovative part of the economy, funded companies like Amazon and eBay, and left behind telecom networks with lasting public benefits.
Which Bubbles Do the Most Damage
The dot-com bust stayed mostly contained, while Japan’s bubble in the 1980s and the subprime housing bubble left their economies damaged for years. Quinn and Turner classify their 12 bubbles two ways:
- Spark type: A government policy or a new technology.
- Borrowing source: Little borrowing, borrowing through markets (like margin loans), or bank loans.
Here’s where each of the 12 falls:
Political bubbles fueled by bank loans prove most destructive. All four such bubbles in their book (France’s Mississippi Bubble in 1720, Australia’s land boom in the 1880s, Japan’s bubble in the 1980s, and the subprime housing bubble of the 2000s) devastated their economies for years.
However, the two technology bubbles with little borrowing, Britain’s bicycle mania in the 1890s and the dot-com bubble, did little harm to the economy. Both funded a new technology that changed daily life.
Two technology bubbles ran on borrowing through markets, Britain’s railway mania in the 1840s and the 1920s bubble on Wall Street, and both were followed by a financial crisis.
1920s Bubble
In the 1920s, the spark was electricity and mass production, but much of the buying was done with borrowed money. Investment trusts could buy stocks with as little as 10% down, and individual investors borrowed from their brokers, who borrowed from banks.
When prices fell in October 1929, margin calls forced investors to sell. The Dow lost 89% from its September 1929 peak to July 1932, and by 1933, the U.S. had almost half as many banks as in 1929.
So in Quinn and Turner’s grid, the least harmful bubbles had a technology spark and little borrowing, and the most harmful had a government spark and bank loans.
Predicting Future Bubbles
Bubbles have become more common. After the 1929 crash, there was no major bubble for over 50 years. From 1990 to 2019, by Quinn and Turner’s count, there was one every 6 years on average, as deregulation beginning in the 1970s made credit easier to get and assets easier to trade.
Several modern trends affect future bubble likelihood:
- Algorithmic trading: Significantly increases marketability (the 2010 “flash crash” saw algorithms move markets 10% in minutes).
- Passive investing: Means rising sectors automatically attract more funds regardless of valuations.
- Private markets: Technology development, including AI, has shifted to venture capital funding rather than public markets. A 2017 study by finance professors at Stanford and the University of British Columbia found the average unicorn, a private startup valued at $1B or more, was overvalued by ~50%. But private shares don’t trade freely, so an overpriced private company can’t crash in public the way a stock can, and by Quinn and Turner’s definition, that isn’t a bubble.
So, what can governments do to prevent or mitigate bubbles?
When it comes to technology bubbles, Quinn and Turner argue governments rarely act because intervention can cause more damage than the bubble itself.
Quinn and Turner also note that the post-1980 consensus treats marketability as purely positive, ignoring ~260 years when societies understood its dangers.
Specific policies that would restrict marketability include financial transaction taxes on each trade and restrictions on securitization that prevent mortgages and loans from becoming highly marketable securities.
Political bubbles (those sparked by government policy) present even fewer solutions since governments won’t constrain themselves. Bank regulation limiting credit growth and directing lending away from speculation could reduce damage, but political incentives often undermine such rules.
Lastly, the media theoretically could expose developing bubbles, but Quinn and Turner found that outlets often amplify rather than moderate speculation. During bubbles, advertising revenue from bubble-related businesses, quid pro quo relationships with sources, and reader demand for optimistic coverage all incentivize puffing over skepticism.
Get Our 50-Question Stock Analysis Checklist!
After researching hundreds of stocks, we built this 50-question checklist to guide your analysis and help you avoid costly mistakes.
Download ChecklistSo examine each situation for the bubble triangle’s elements while watching for political or technological sparks. Understanding bubbles requires more than financial knowledge, as Quinn and Turner conclude:
“Sociology, technology, psychology, political science and, most importantly, history are required to inform the mental models of investors.”
— Quinn and Turner, Boom and Bust
Is the AI Boom a Bubble?
The AI boom started on November 30, 2022, when OpenAI released ChatGPT. Within two months, ChatGPT had an estimated 100 million monthly users, which UBS called the fastest growth of any consumer app at the time, per Reuters. Tech companies then raced to build bigger AI models, and the data centers and chips to run those models.
The Nasdaq rose ~140% from ChatGPT’s release to its all-time high on October 6, 2026. Nvidia (NVDA), whose chips AI companies use to train their models, became the world’s most valuable company, worth just under $5.8T by early October 2026, per Bloomberg.
I think the AI boom displays all three elements of Quinn and Turner’s bubble triangle, but the money and credit side has changed the most since the dot-com era.
Marketability
Marketability has kept rising since the dot-com era. The biggest U.S. brokers have charged no commission on online stock trades since October 2019. The SEC also approved Nasdaq’s plan to trade stocks 23 hours a day, five days a week, in April 2026, and Nasdaq expects to start on December 6, 2026.
The biggest change since Quinn and Turner wrote their book is that private AI companies are becoming tradable. In February 2026, SpaceX acquired xAI, Elon Musk’s AI company, and in June 2026, SpaceX went public in the largest IPO on record, raising $75B with 30% of the shares set aside for individual investors, per Reuters.
A Robinhood fund that listed on the New York Stock Exchange in March 2026 has also bought ~$75M of OpenAI stock, and anyone can buy into it, with no minimum.
However, the companies going public in 2025 were older than in 1999, and their stocks jumped less on their first day. In 2025, the median company going public was 12 years old, vs. 5 in 1999 and 2000. The average IPO rose 29% on its first day, vs. 71% in 1999.
Index funds also send more money into the biggest stocks automatically. An index fund buys each stock in proportion to its size, and index funds held 52% of the assets in U.S. long-term funds at the end of 2025, up from 19% in 2010. The more the biggest AI stocks rise, the more of each new dollar those stocks get.
As of September 30, 2026, the information technology sector made up 39.7% of the S&P 500, above its ~33% peak in 2000.
Money and Credit
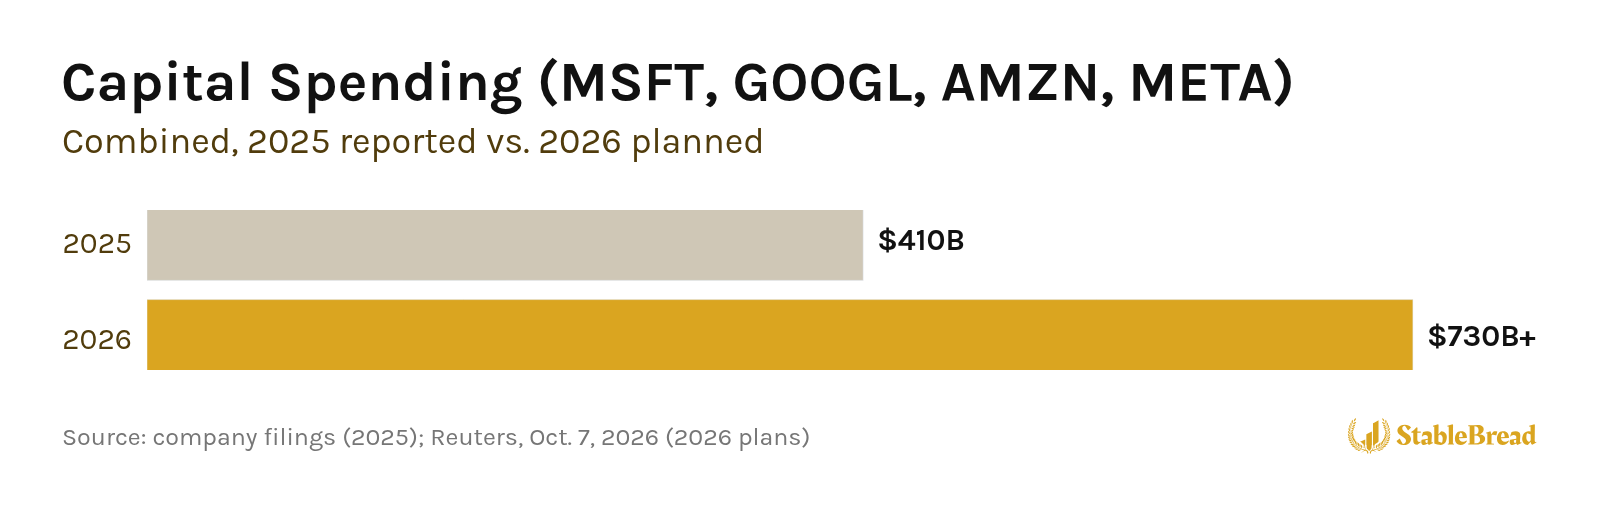
Money and credit show up in how much the biggest tech companies are spending on AI. Microsoft (MSFT), Alphabet, Amazon, and Meta are on track to spend more than $730B in 2026 on data centers, chips, and other equipment, mostly for AI, up from ~$410B in 2025:
Most of that is still paid for with the cash their businesses bring in, and FactSet expects Alphabet and Microsoft to bring in more cash than they spend in 2026. However, at Amazon, Meta, and Oracle, the spending is catching up with the cash. Amazon’s free cash flow, the cash its business brought in minus its capital spending, was negative $7.6B over the 12 months to June 2026, per its Q2 2026 earnings release.
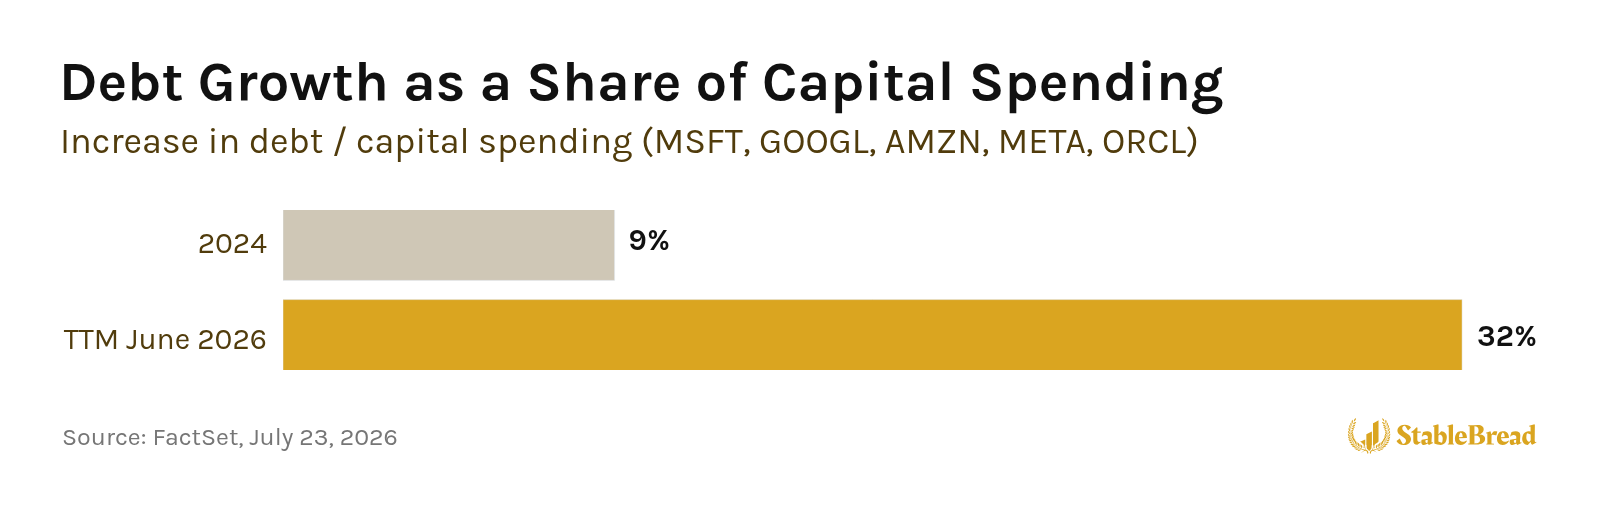
So debt is covering a growing share of the bill. Over the 12 months to June 2026, the debt of Microsoft, Alphabet, Amazon, Meta, and Oracle grew by an amount equal to 32% of their capital spending, up from 9% in 2024:
Amazon, Alphabet, Meta, and Oracle sold ~$194B of bonds in 2026 through early July, up from ~$108B in all of 2025, according to a Reuters analysis of LSEG data. In February 2026, Alphabet even sold a 100-year bond.
Some of the borrowing also comes from banks. In September 2026, the Financial Times reported that ~$18B of bank loans for Project Jupiter, a data center Oracle is leasing in New Mexico to serve OpenAI, were being quoted at 89-91 cents on the dollar. Efforts to sell the loans to other investors had stalled, so banks were holding more of the debt than they’d planned.
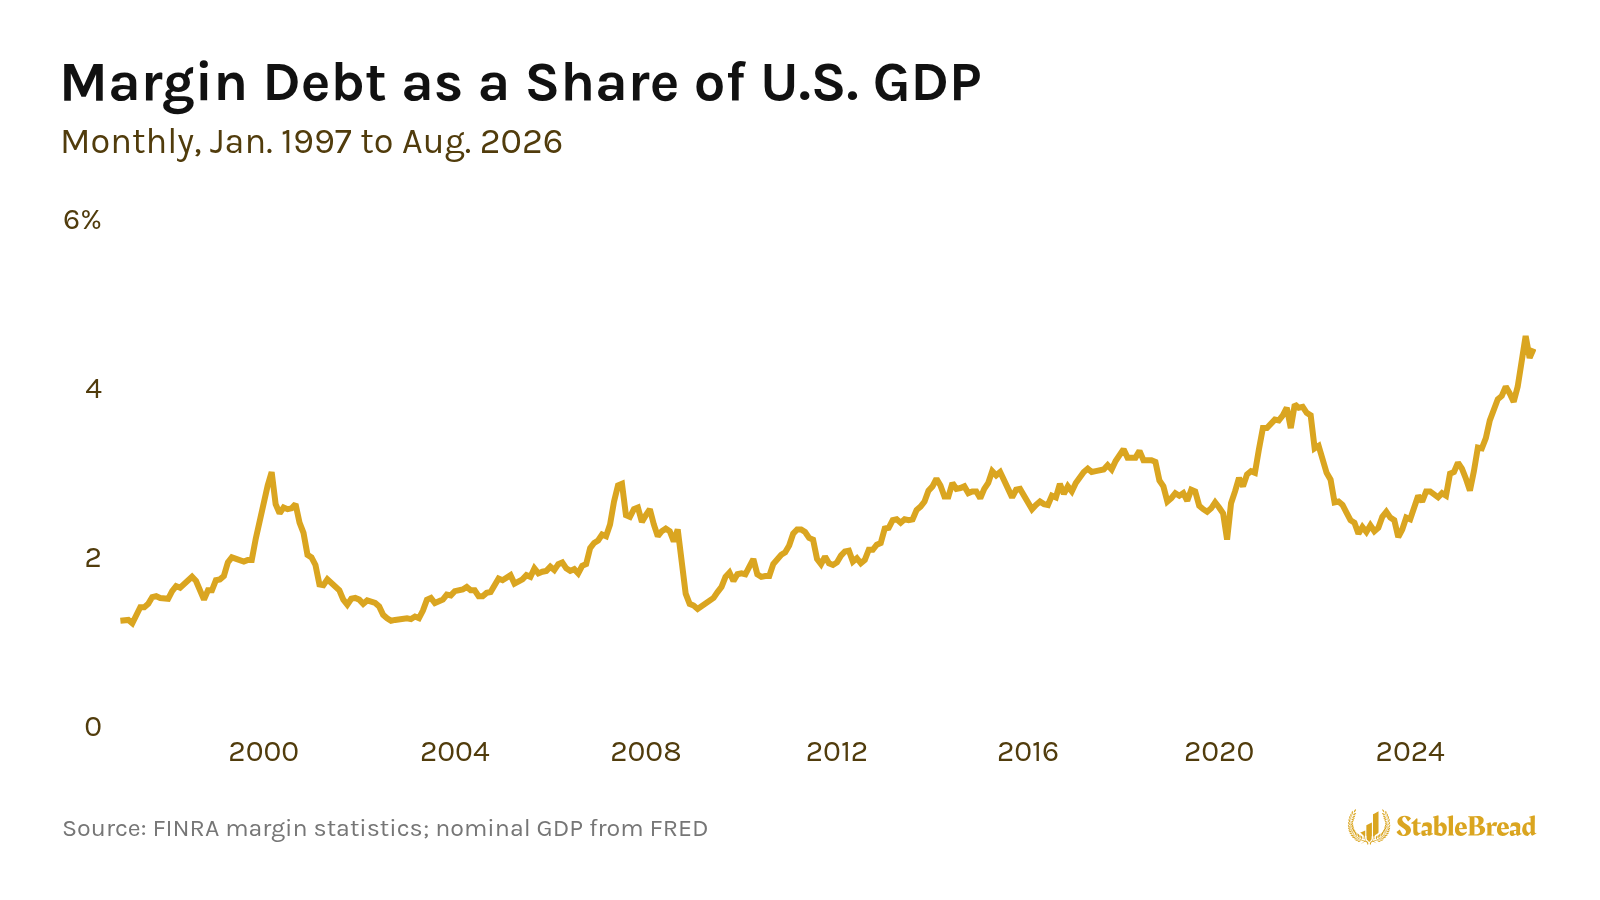
Investors with brokerage accounts, from individuals to institutions, are borrowing too. Margin debt hit a record $1.5T in June 2026.
Measured against the size of the economy, margin debt is ~4.6% of U.S. GDP, vs. 3% at the dot-com peak in March 2000:
Related: How to Use Margin Without Getting Wiped Out
At the same time, that fuel is getting more expensive. On September 16, 2026, the Fed raised its target for the federal funds rate, the rate banks charge each other for overnight loans, by 0.25% to a range of 3.75-4%, its first increase since July 2023. On October 5, 2026, the 10-year Treasury yield closed at 5.31%, its highest level since May 2002.
The minutes of that Fed meeting even note that, according to market commentary, competition for money from heavy AI borrowing helped push Treasury yields higher.
Quinn and Turner note that one way bubbles end is by running out of fuel, when higher interest rates or tighter credit make it harder to borrow. So the AI boom is leaning more on borrowed money just as borrowing gets more expensive.
Speculation
One way to gauge speculation is how much investors are paying for each dollar of company earnings. The Shiller CAPE, the S&P 500’s price divided by its average inflation-adjusted earnings over the last 10 years, has been above 40 every month since May 2026, for the first time since 2000. The Shiller CAPE’s record is 44, from December 1999:
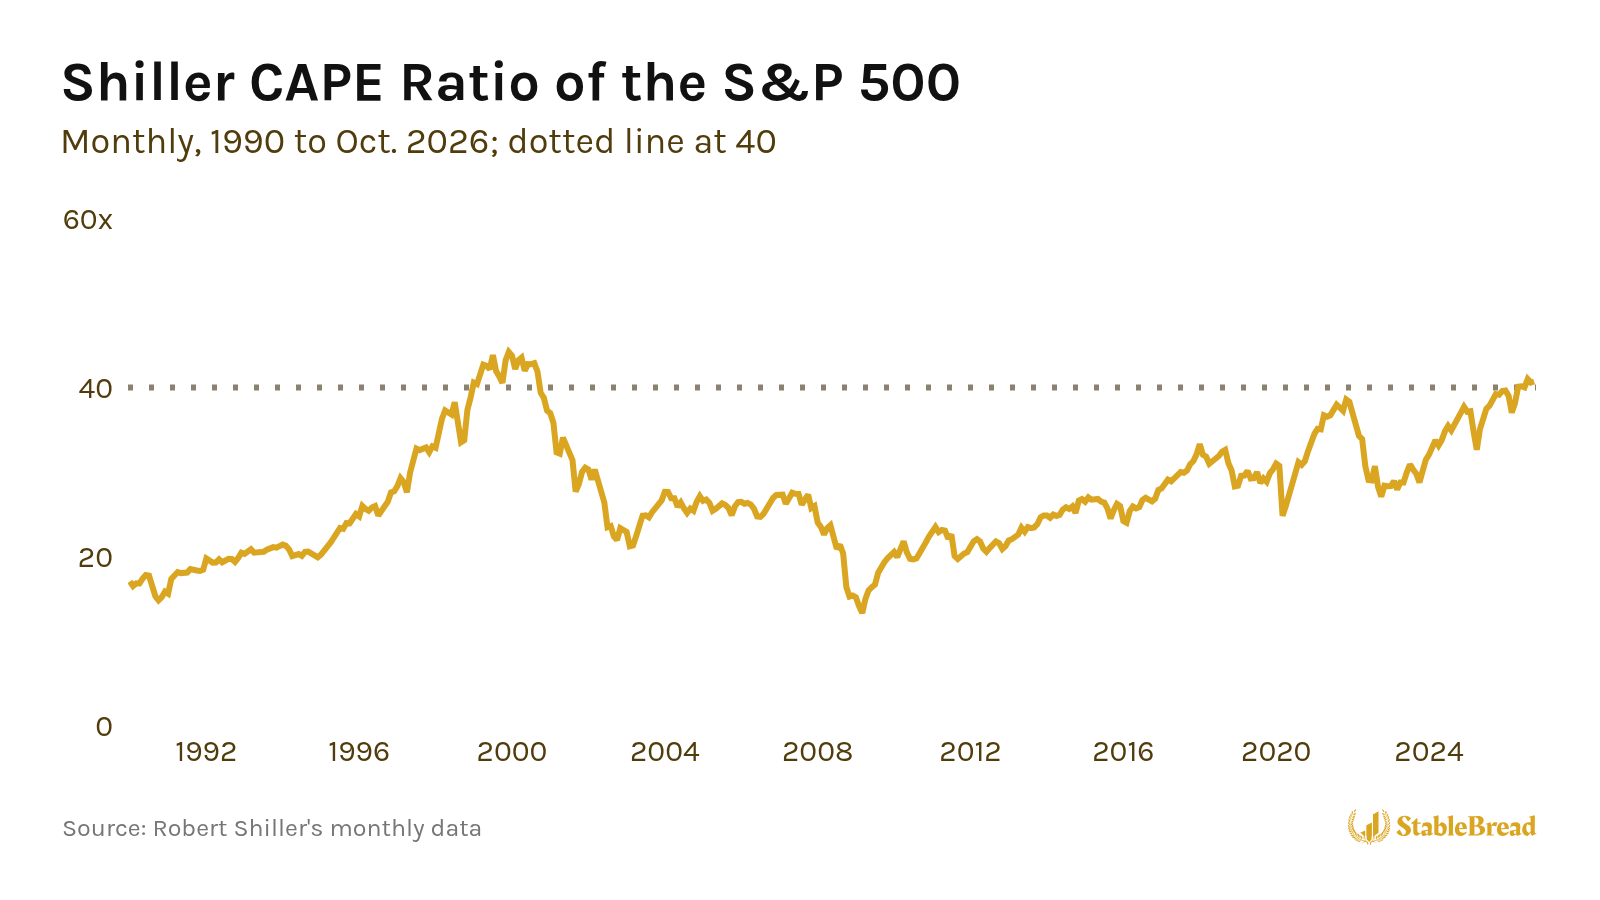
However, the S&P 500 is cheaper than in 2000 when you compare its price with the profits analysts expect over the next 12 months. The S&P 500’s price was 19x those expected profits as of September 30, 2026, vs. 25x in March 2000, per J.P. Morgan’s Guide to the Markets.
By that measure, stocks are less expensive than at the dot-com peak.
Private valuations have soared too. OpenAI raised $122B at an $852B valuation in March 2026, and it’s reportedly in talks to raise money at ~$1.4T. According to the Financial Times, OpenAI expects ~$36B of revenue in 2026, and expects to burn through $278B of cash from 2026 to 2030.
In 2026 through September, AI startups raised 82.7% of the money U.S. venture capital firms invested, the highest share on record.
Speculation has also become circular and self-reinforcing. Major players invest in each other while simultaneously transacting as customers, creating feedback loops that inflate valuations, as the Bloomberg visual below illustrates:
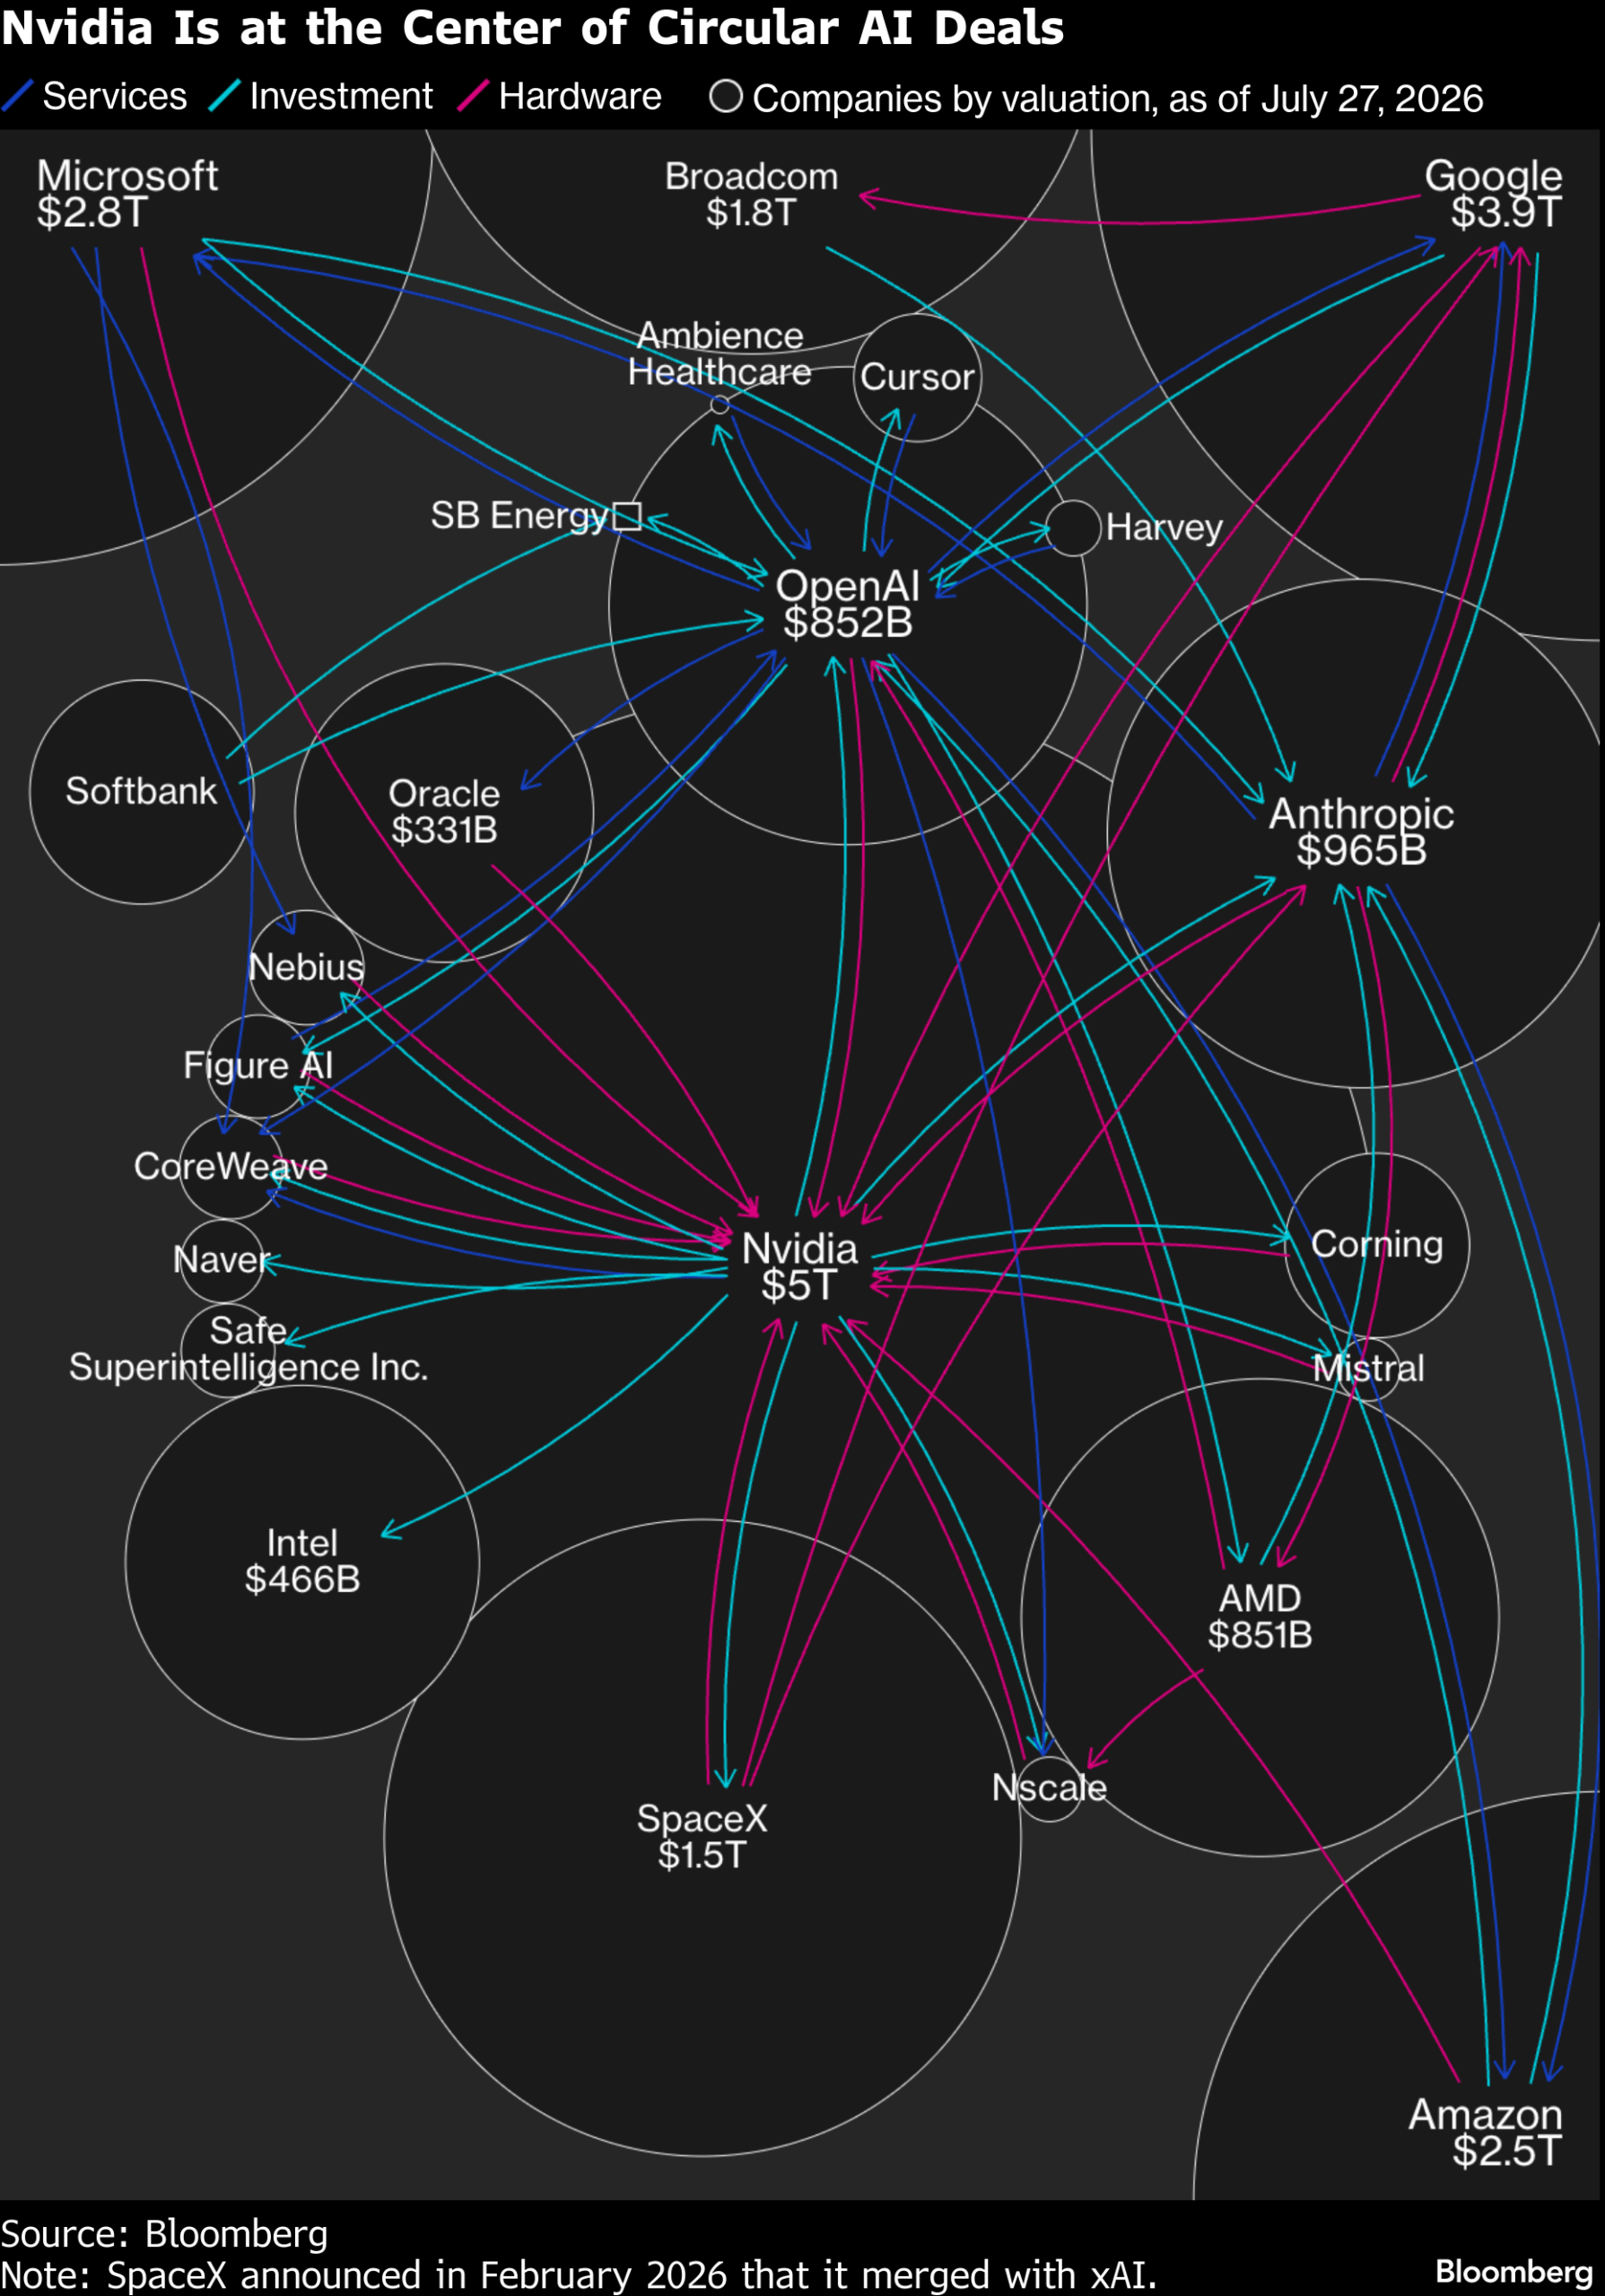
Nvidia, for example, said it would invest up to $100B in OpenAI, which plans to fill its data centers with Nvidia’s chips, and that plan became a $30B stake in March 2026. Amazon also invested $50B in OpenAI in 2026, while OpenAI agreed to spend another $100B on Amazon’s cloud over eight years.
The circle has kept growing. In August 2026, Nvidia agreed to guarantee up to $105B for a data center campus that SB Energy, a SoftBank-backed developer, is building to run Nvidia’s chips for OpenAI.
The AI trade has also had sharp drops along the way. In July 2026, the Philadelphia Semiconductor Index, which tracks 30 of the largest chip stocks, fell 21%, its worst month since October 2008. By October 6, 2026, the Nasdaq had recovered to an all-time high.
Where the AI Boom Fits
The AI boom’s spark is a new technology, like the dot-com bubble’s, but I’d no longer put it in the little borrowing box. A growing share of the spending is funded with debt, through bonds and bank loans, and investors are buying stocks with record margin debt. That moves it toward the box where the 1840s railway mania and the 1920s bubble both ended in financial crises.
One difference from 2008 is that households aren’t borrowing heavily. U.S. household debt has fallen from 98% of GDP in early 2008 to ~66% in mid-2026, its lowest level since 1998:
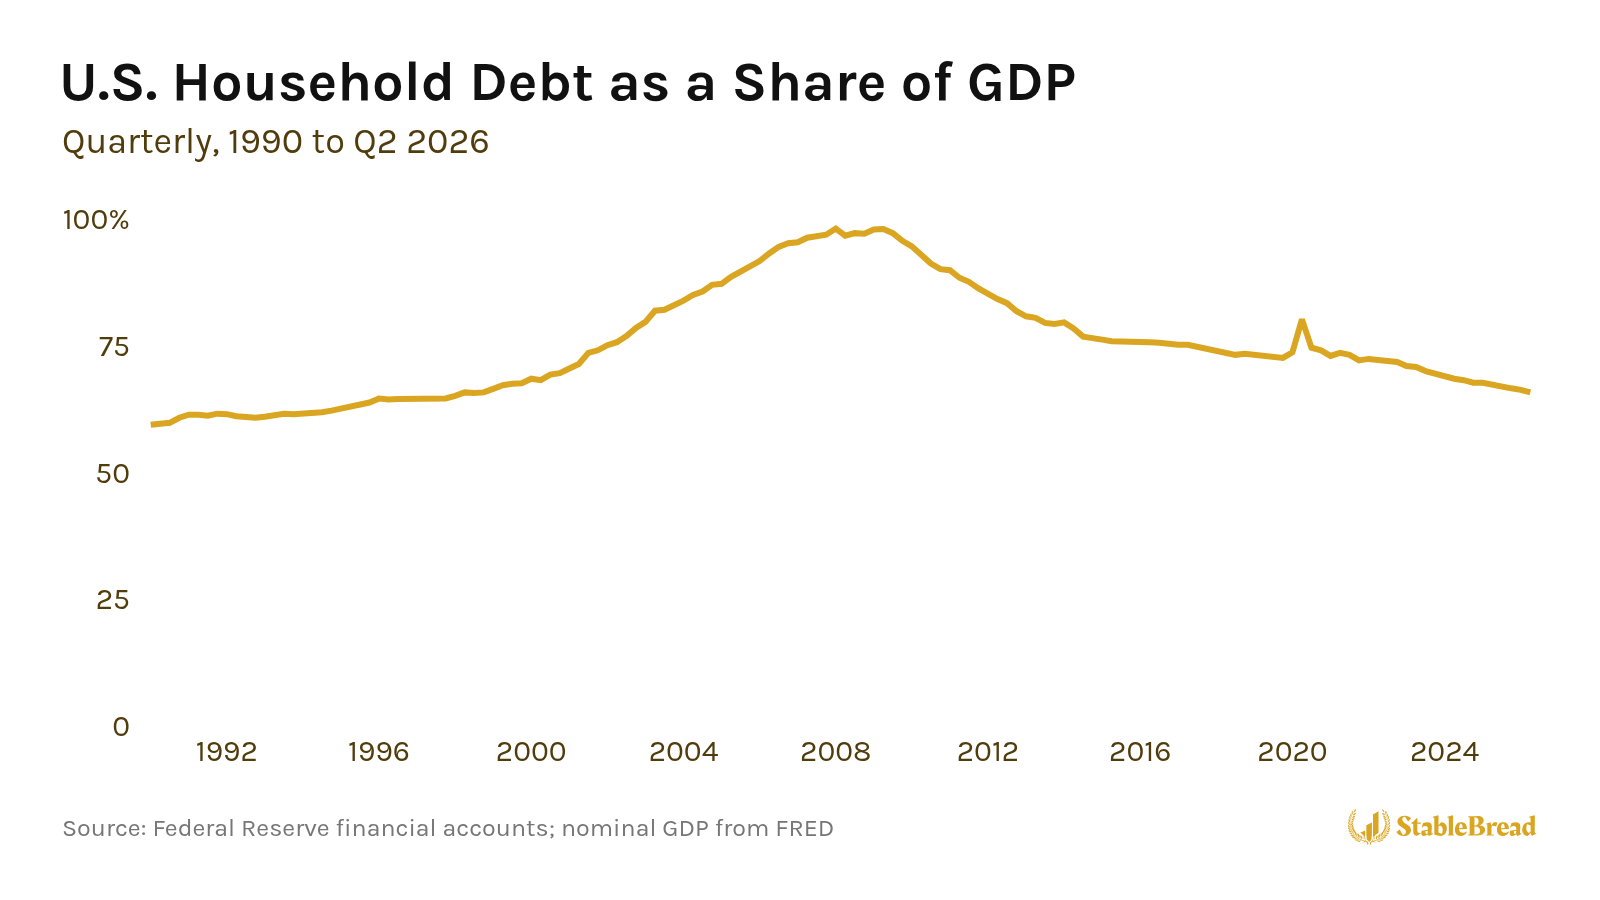
Household debt kept falling as a share of GDP through the AI boom, from ~72% when ChatGPT launched.
What to Watch
Quinn and Turner advise most investors to stay out of bubbles, since insiders and experienced investors tend to profit from them at newcomers’ expense. After a bubble bursts, prices often drop further than they should, which gives investors a chance to buy at bargain prices.
Quinn and Turner compare new technology stocks to lottery tickets. Most lose money, but a few pay off hugely. For example, $100 invested in Amazon’s 1997 IPO was worth ~$49,000 by 2017.
From here, I’d watch the cost of borrowing, who ends up holding the debt, and whether AI revenue keeps up with the spending:
- Cost of borrowing: The 10-year yield, the Fed’s next rate decisions, and whether new AI bonds keep losing value after they’re sold. As of late July 2026, 78 of the 91 bonds that the biggest cloud companies sold in 2026 traded at higher yields, meaning lower prices, than when they were issued.
- Who holds the debt: Whether more data center loans get stuck on banks’ balance sheets, like the ~$18B of loans for Project Jupiter.
- AI revenue: Bain estimated in September 2026 that funding the data centers being planned would take an AI market approaching $6T a year by 2031.
My free macro dashboard tracks some of these readings every week, like the Shiller CAPE and the 10-year yield.
If the borrowing keeps growing and more of it ends up with banks, the AI boom will look less like the dot-com bubble, where the losses fell mostly on stock investors, and more like the 1920s, when margin calls and bank failures spread the crash to the whole economy.
If AI revenue catches up with the spending, the companies can pay for more of it from their own cash, and a bust would look more like 2000, painful for investors but limited for the economy.
