

From 1962 to 1982, Gillette, the razor maker, grew its earnings 250%, yet its share price rose only ~40%. Investors went from paying ~20x its earnings to just ~10x.
The opposite happened at MTY Food Group, a Canadian restaurant franchisor. In 2003, the entire company was worth $5M, and investors paid ~3.5x its earnings.
Over the next 10 years, MTY’s earnings per share (EPS) grew 13x. By 2013, investors were also paying ~26x those earnings, so its share price rose 100x:
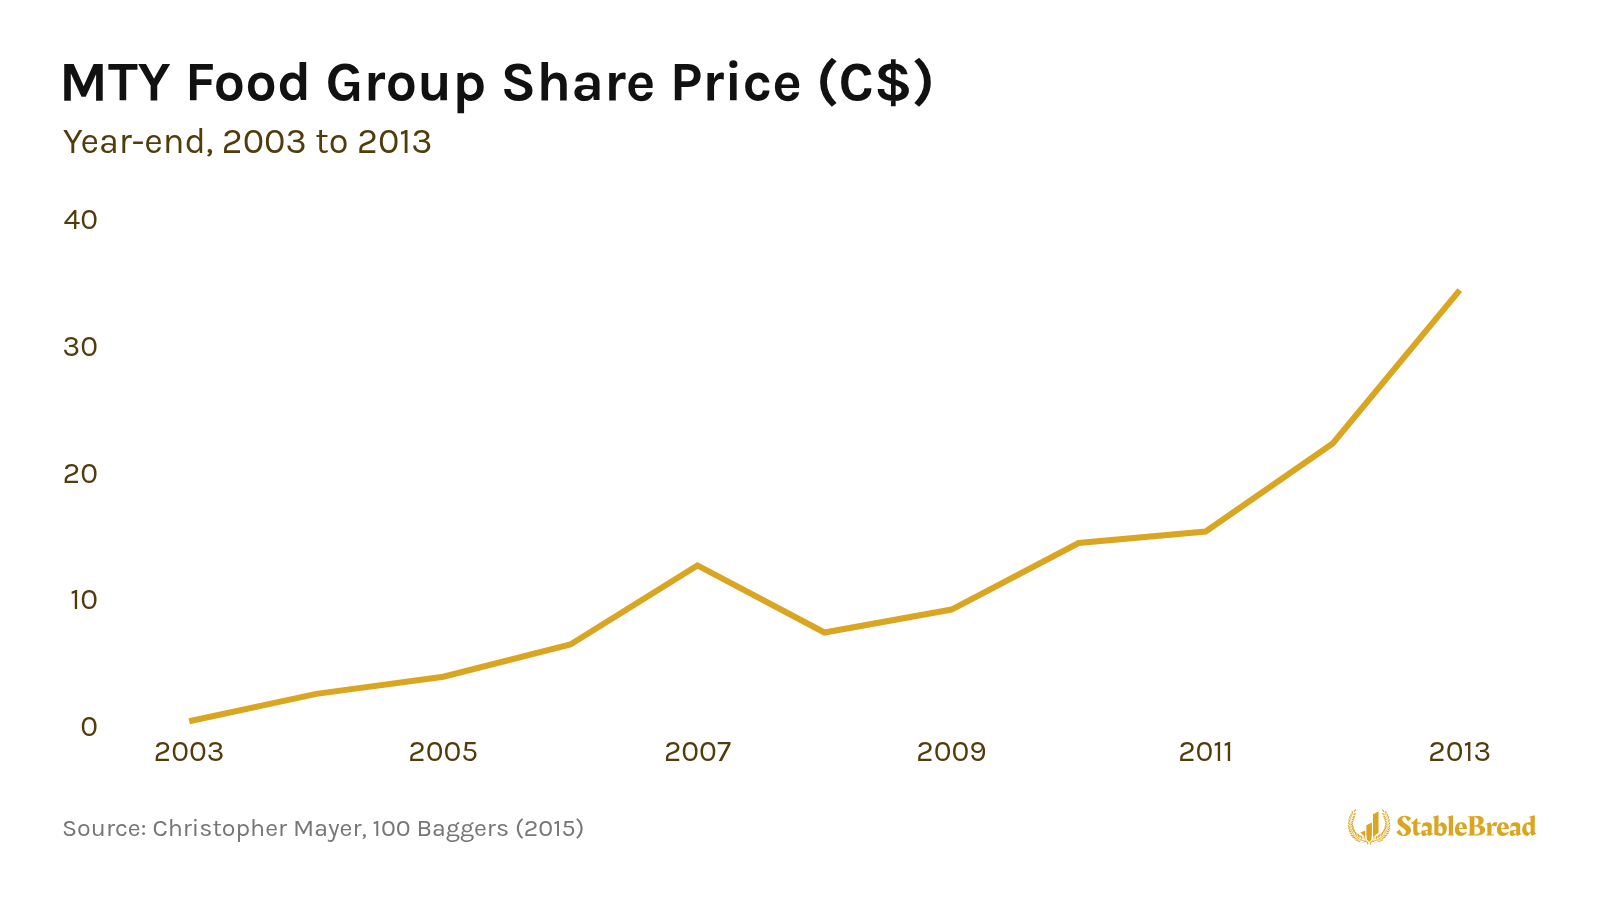
A stock that returns 100x your money is called a 100-bagger. MTY got there with what Christopher Mayer calls the twin engines, meaning its earnings grew and investors paid more for each dollar of those earnings.
So what did stocks like MTY have in common before they rose? A 2015 book, a 2022 report and a 2025 paper have each tried to answer that question.
Together, the three studies looked at 1,275 stocks that rose 10-100x from 1962 to 2024 (a few appear in more than one study). Investors call stocks like these multibagger stocks.
For a stock to rise 11x in 10 years without investors paying more for each dollar of its earnings, those earnings have to grow ~27%/year. Of the 446 stocks around the world that rose more than 11x from 2012 to 2022, only 31% grew their earnings that fast. So like MTY, most of those 446 stocks also needed investors to pay more for each dollar of earnings.
If you buy individual stocks, these three studies can help you judge whether a company has the traits of a multibagger, and how long you might have to hold the position to earn a 10x return.
Below, I’ll walk through how each study worked, where the winners came from, what the winners looked like before they rose, why fast earnings growth alone wasn’t enough to find multibaggers, and the four findings all three studies share.
Three Studies
The idea of studying the biggest winners goes back to a 1972 book by Thomas Phelps, a former Barron’s editor who later became a partner at the investment firm Scudder, Stevens & Clark. In 100 to 1 in the Stock Market, he listed 365 investments, mostly stocks, that rose 100x or more between 1932 and 1971.
Mayer’s 100 Baggers (2015)
In 2015, Christopher Mayer repeated that study with more recent data in his book 100 Baggers. He was writing investment newsletters at the time, and he later co-founded Woodlock House Family Capital, a fund manager that opened in 2019. Mayer says an independent review found that his newsletter’s recommendations returned 16%/year over its first 10 years.
Mayer screened a database of U.S. stocks for the ones that returned at least 100x from 1962 to 2014, with dividends reinvested, and just like Phelps, he found 365. He then studied a handful of them in depth. Mayer himself says his book isn’t a statistical study, but “a set of principles you can use to identify winners.” I cover those principles in how Chris Mayer screens for 100-baggers.
Jenga’s Global Outperformers (2022)
In 2022, Jenga Investment Partners, a London investment firm founded in 2021, published Global Outperformers, a report on 446 stocks around the world whose share price rose more than 11x from May 2012 to May 2022. Each one had to be worth at least $550M by May 2022, and Jenga excluded six countries where inflation ran above 30%. The report ends on lessons for investors, which I go through in 10 lessons from 446 global 10-bagger stocks.
Yartseva’s Alchemy of Multibagger Stocks (2025)
Most recently, in February 2025, Anna Yartseva of Birmingham City University in the U.K. published The Alchemy of Multibagger Stocks, a working paper on 464 stocks listed on the New York Stock Exchange and the Nasdaq. The share price of each one rose at least 10x from January 2009 to January 2024, and the list also includes foreign companies listed in the U.S.
Yartseva tested more than 150 measures, from valuations to profit margins to recent price moves, to see which ones predicted how the stocks did the following year. I go through her models in what 464 10-baggers reveal about predicting stock returns.
Only the Winners
All three studies, however, only looked at stocks that had already won. Mayer admits as much in his book.
A statistician who read his newsletter compared the approach to taking blood samples from the starting lineups of NBA teams to find out what makes basketball players tall. There are no short people in that sample.
Jenga, on the other hand, says its research covers “only half the story.” The report also counted 5,243 listed companies whose share price was at least 50% below where it had been 10 years earlier. Yartseva’s paper never mentions this blind spot, not even in its section on the paper’s limitations.
So most of the numbers below describe the winners only, not how similar stocks may have failed.
Where the Winners Came From
In Yartseva’s sample, tech produced the most winners, but only 20% of the total. Industrials made up 19%, consumer discretionary companies like car makers and clothing brands 18%, and healthcare 14%. Within tech, chipmakers outnumbered software companies 42 to 26.
Jenga’s winners leaned even more toward tech. Tech companies made up 25.8% of its winners, about twice their 12.7% share of listed companies. Jenga counted only one chip stock among the winners from 2002 to 2012, but 44 from 2012 to 2022.
Many of the winners came from cyclical industries, whose sales rise and fall with the economy. Jenga counts 47% of its winners in industries like mining, construction, airlines and chipmaking, and Mayer’s top five even include a railroad, a tobacco company and an oil refiner. So if you screen out entire sectors, you’d cut out many of the winners.
Jenga also looked by country, and 59% of its winners were Asian companies, while global mutual funds keep only 10% of their money in Asia. India alone had more winners than the U.S., even though the U.S. had more than 3x as many listed companies:
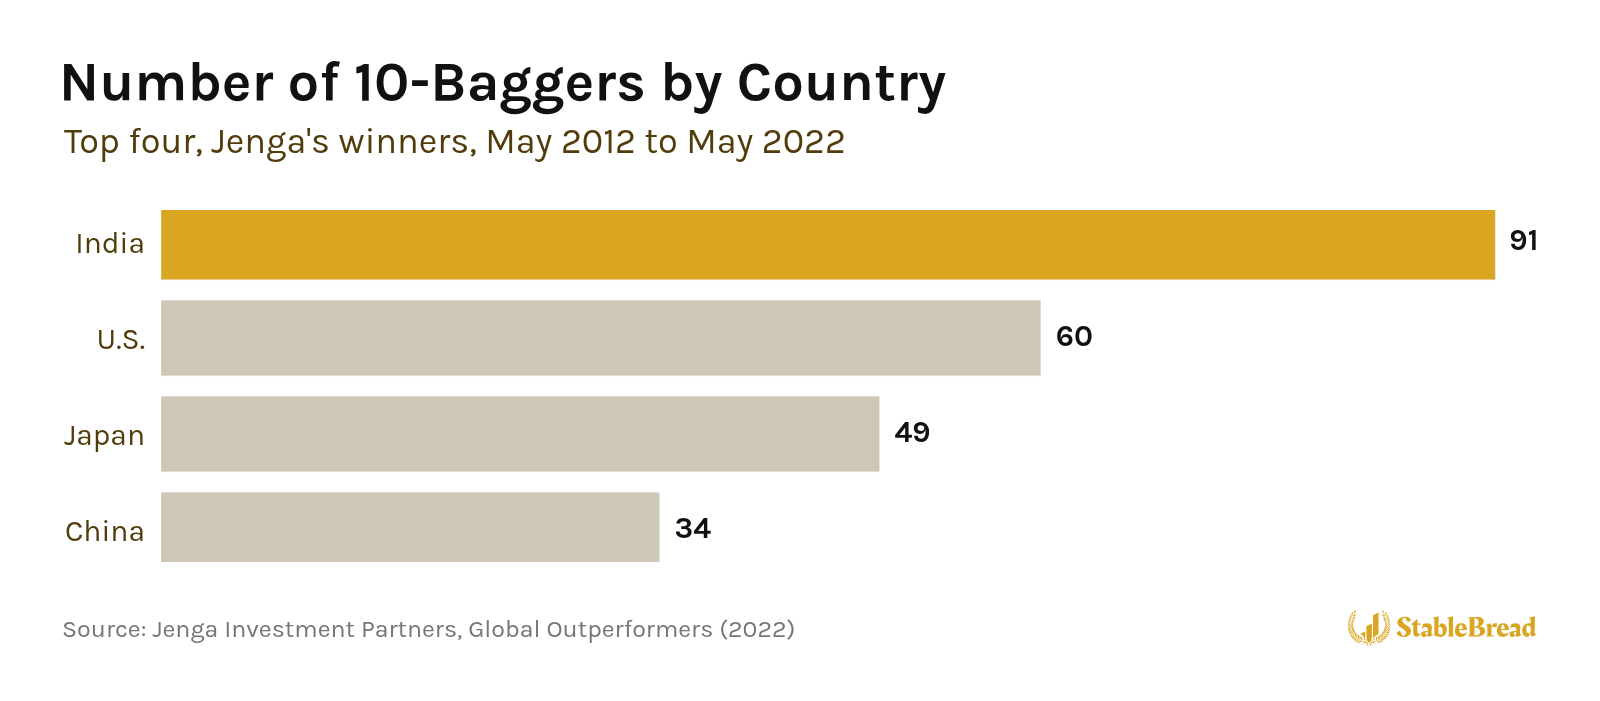
Japan had 49 winners after having none at all from 2002 to 2012. However, Jenga measured each stock in its own currency. Sony’s (SONY) share price rose 11.5x in yen, enough to make the list, but only ~600% for someone holding it in dollars, because the yen fell 39% against the dollar.
In dollars, nearly three-quarters of India’s winners still rose more than 11x, but fewer than half of Japan’s did.
The winners also rarely repeated. Only 23 of the 446 had also risen more than 11x in the decade before. In other words, the winners of one decade were rarely the winners of the next.
Get Our 50-Question Stock Analysis Checklist!
After researching hundreds of stocks, we built this 50-question checklist to guide your analysis and help you avoid costly mistakes.
Download ChecklistHow Big They Were at the Start
Mayer’s median 100-bagger started out with ~$170M of annual sales and a market value of ~$500M. He suggests looking at companies worth less than $1B. However, he says it’s a myth that you have to start with tiny companies, since a business with $170M of sales isn’t a 50-cent stock with barely any revenue.
Yartseva’s median winner was worth even less, $348M in January 2009, but it already had $702M of revenue.
Jenga’s winners started even smaller. Jenga’s size count includes 935 stocks that rose more than 11x, and 63% of them were worth less than $50M in 2012, compared with 46.5% of all listed companies.
Only 7 were worth more than $10B, like Amazon (AMZN), ASML (ASML) and Adobe (ADBE). Jenga notes that more of the tiniest companies probably also went bankrupt.
Even among Yartseva’s winners, the smallest did the best. On average, her small winners beat the S&P 500 by 37.7% the following year, vs. 9.7% for the largest group.
Starting small also leaves more room to grow. A company worth $500M has to reach $50B to rise 100x. Mayer’s example was Apple (AAPL), which was worth $750B in 2015, so rising 100x would have made Apple worth $75T, more than 4x the size of the U.S. economy.
How Cheap They Were at the Start
In January 2009, Yartseva’s median winner traded at 0.6x its sales and 11.3x the earnings analysts expected over the following 12 months.
Jenga measured value a little differently, with enterprise value (EV), a company’s market value plus its debt minus its cash. In May 2012, half of Jenga’s winners had an EV below one year of their sales, and 48.9% of the profitable ones traded below 10x their operating profit (EV/EBIT).
However, Mayer’s 100-baggers weren’t that cheap. His median one traded at nearly 3x its sales, and he warns against hunting for stocks at price-to-earnings (P/E) ratios of 5 or far below their book value.
Even in Jenga’s data, the most expensive winners, at more than 30x operating profit, went on to grow their operating profit 34.3%/year over the next three years, more than twice the 15.6% of the cheapest:
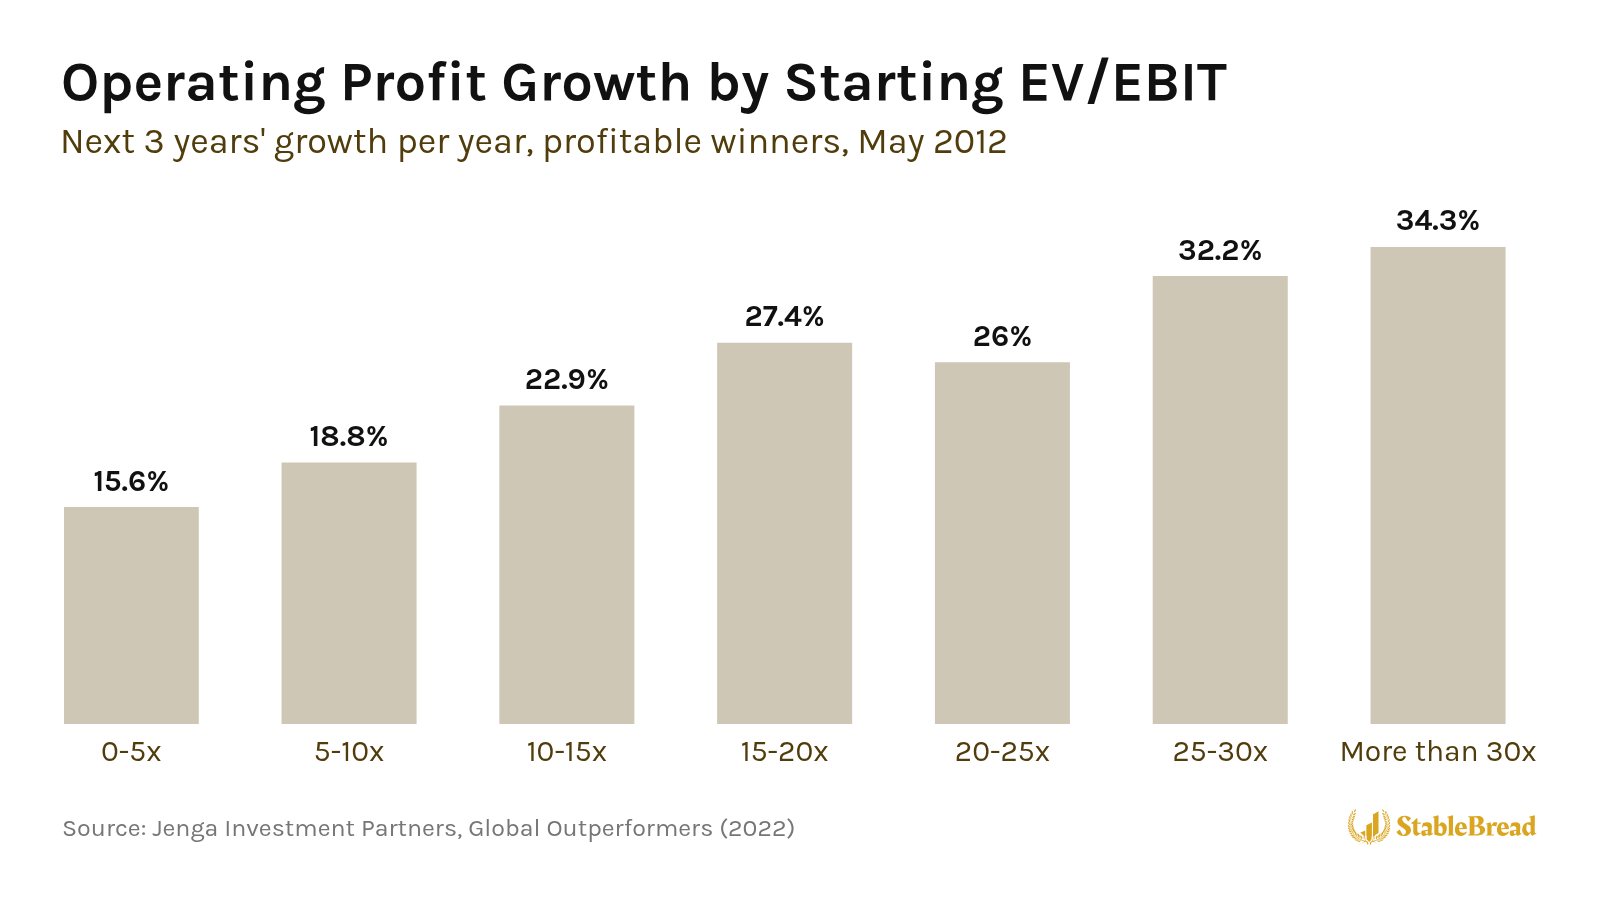
So the winners weren’t simply cheap, but cheap compared with how fast they went on to grow.
Jenga’s rule of thumb compares the multiple of operating profit you pay with how fast that operating profit grows per year over the next three years, and the multiple should be the smaller number. For example, a company valued at 10x its operating profit that grows 15%/year passes, since 10 is less than 15. In 2012, 93% of Jenga’s profitable winners passed that test, although nobody could have known their growth in advance.
In Yartseva’s models, cheaper stocks also did better the following year. The strongest predictor was free cash flow yield, the cash a company has left after its capital spending divided by its market value:
FCF Yield = (Operating Cash Flow - Capital Expenditures) / Market Value
Free cash flow yield predicted the following year’s return in all seven of her models, and she calls it the most important driver of the winners’ returns.
Book-to-market, a company’s book value (shareholders’ equity) divided by its market value, also predicted returns. In her portfolios, every group whose book value was at least 40% of its market value and that made an operating profit beat the S&P 500 the following year.
On the other hand, small companies that were losing money, shrinking, and owed more than they owned did the worst. The median one fell 18.1% the following year.
Why Earnings Growth Alone Wasn’t Enough
Yartseva tested every common measure of growth, from sales to profits to EPS, over one year and over five. None of them predicted how the winners did the following year, which she calls surprising.
That doesn’t mean the winners didn’t grow their earnings. From 2009 to 2024, the median winner grew its EPS 20%/year, and its share price rose 21.4%/year:
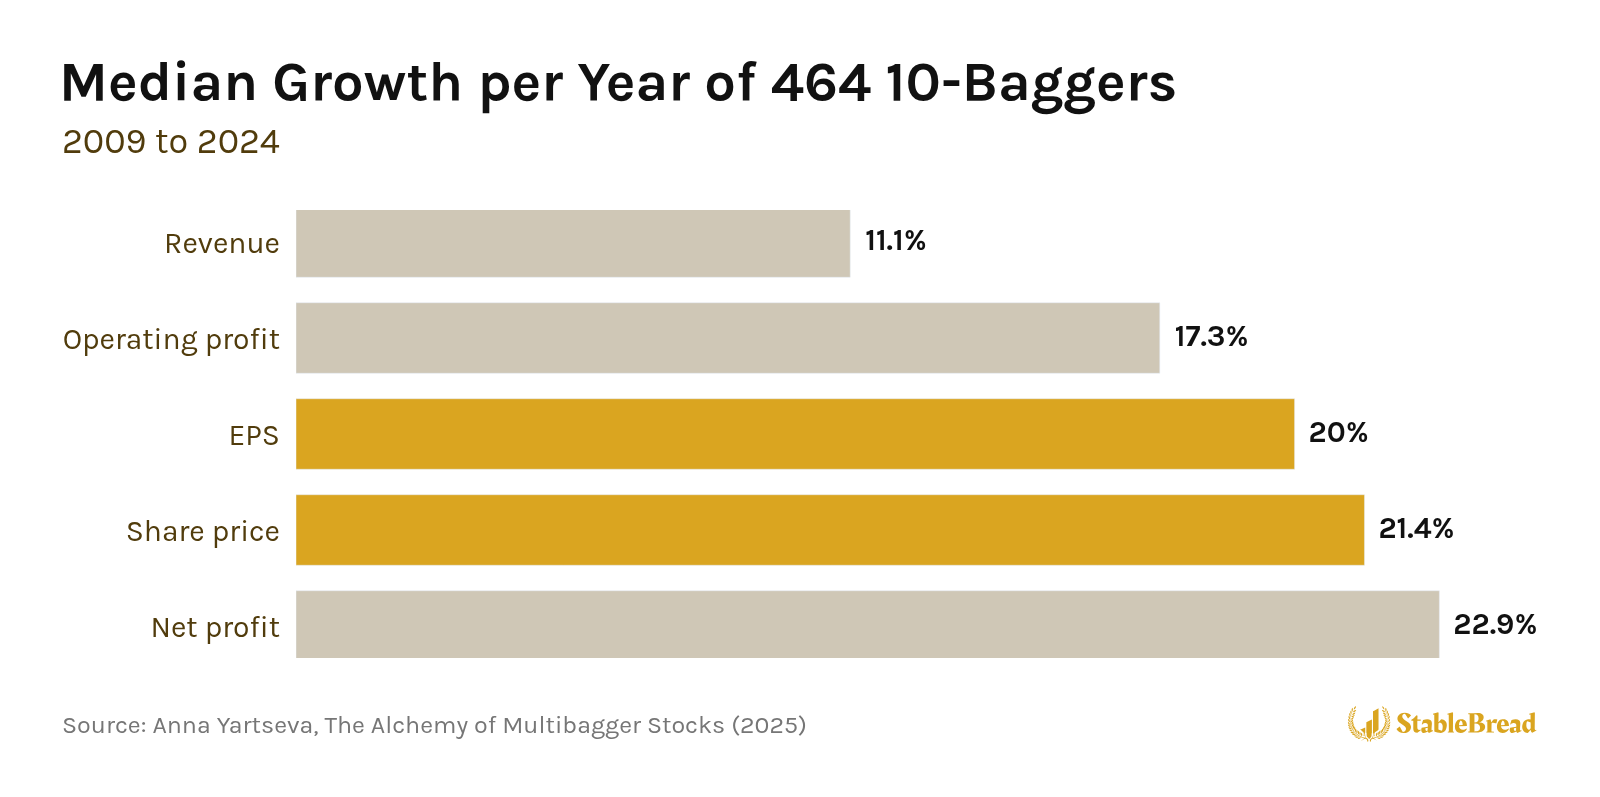
So over those 15 years, earnings growth did most of the work. A company’s growth over the previous year just didn’t tell you which of the winners would rise the most over the following year. For context, the Nasdaq-100 rose 19.1%/year over the same 15 years, so the median winner rose 18.3x vs. 13.8x for the index.
Jenga’s winners grew more slowly than you might expect. Most of them (72%) grew their sales less than 20%/year, and the average profitable one grew sales 15%/year and operating profit 20%/year.
Jenga also checked the other way around, starting from the fastest growers. Of U.S. companies whose earnings grew more than 27%/year over the decade, only 14% saw their share price rise more than 11x.
Some winners didn’t grow their sales at all. From 2011 to 2021, Neste, a Finnish oil refiner, saw its revenue fall from €14.2B to €13.6B. However, as Neste moved into renewable diesel, its operating margin went from 1.6% to 14.8%, and its share price rose more than 17x from May 2012 to May 2022.
Mayer says growth is essential, but he doesn’t insist that it shows up in reported earnings. Amazon is his example. In 2014, after spending $9.2B on research and development (R&D), Amazon reported an operating margin of just 0.2%, and by May 2015, its stock had still risen 283x since its 1997 IPO.
So what Mayer looks for is what Phelps called earnings power, meaning what a business could earn, rather than what it reports in a given year.
Twin Engines
A stock’s rise comes from two sources, which Mayer calls the twin engines. The first is earnings growth, and the second is a rising multiple, meaning investors pay more for each dollar of earnings:
Share Price = EPS × P/E Ratio
From 2001 to 2006, Hansen Natural, the company behind Monster Energy, grew its EPS from 4 cents to ~$1, or 25x. Investors also went from paying 10x its earnings to 50x, so its stock rose 125x (25 × 5).
To show why the starting price matters, Mayer compares two companies whose EPS both grow from $1 to $20 over 20 years, and both end up at 25x earnings. If you bought the first at 5x earnings, it’s a 100-bagger. If you bought the second at 50x, it’s only a 10-bagger.
Across Jenga’s winners, 91% ended the decade at a higher multiple of their sales, and 72% of the profitable ones ended at a higher multiple of their operating profit.
Lasertec and Japan’s Bubble
¥100 invested in Lasertec in 1992 was still worth ¥100 in 2012. Lasertec makes machines that inspect photomasks, the stencils used to print circuit patterns onto chips.
Jenga says one reason its stock went nowhere is that Lasertec went public during Japan’s bubble, when Japanese stocks were very expensive. From 1984 to 1989, the P/E ratio of the Nikkei, Japan’s main stock index, climbed from 38 to 70.
By 2012, Lasertec was valued at just 6.4x its operating profit. Lasertec then became the only supplier to chipmakers like TSMC, Samsung and Intel of the tools that inspect the photomasks for EUV machines, the most advanced chipmaking machines (as of 2022, per Jenga).
Lasertec’s earnings grew 51%/year over the four years after 2017. By 2022, investors were paying 67x its operating profit, so its share price rose 103x from May 2012 to May 2022.
Lasertec was one of Japan’s 49 winners from 2012 to 2022. By 2011, the median Japanese stock traded at 11x its earnings, and Sony was valued at 0.15x its revenue. So many Japanese stocks started the decade cheap enough for both engines to work.
The second engine can also run in reverse. Over nine months in 2022, 18% of Jenga’s winners fell more than 30%, and three that had reached more than 100x their operating profit fell more than 60% from their peaks.
What Kept Them Compounding
Most of the 10-baggers were already profitable before they rose. In 2012, 82% of Jenga’s winners had an operating profit.
Yartseva’s winners were profitable as well, but barely. In 2009, a recession year, their typical operating margin was 3.9%, and their typical return on equity (ROE), net income as a percentage of shareholders’ equity, was 9%.
What changed was that their operating margins went up, meaning they kept more of each dollar of sales as operating profit. Among Jenga’s profitable winners, the share with operating margins above 10% went from 48% in 2012 to 85% in 2021:
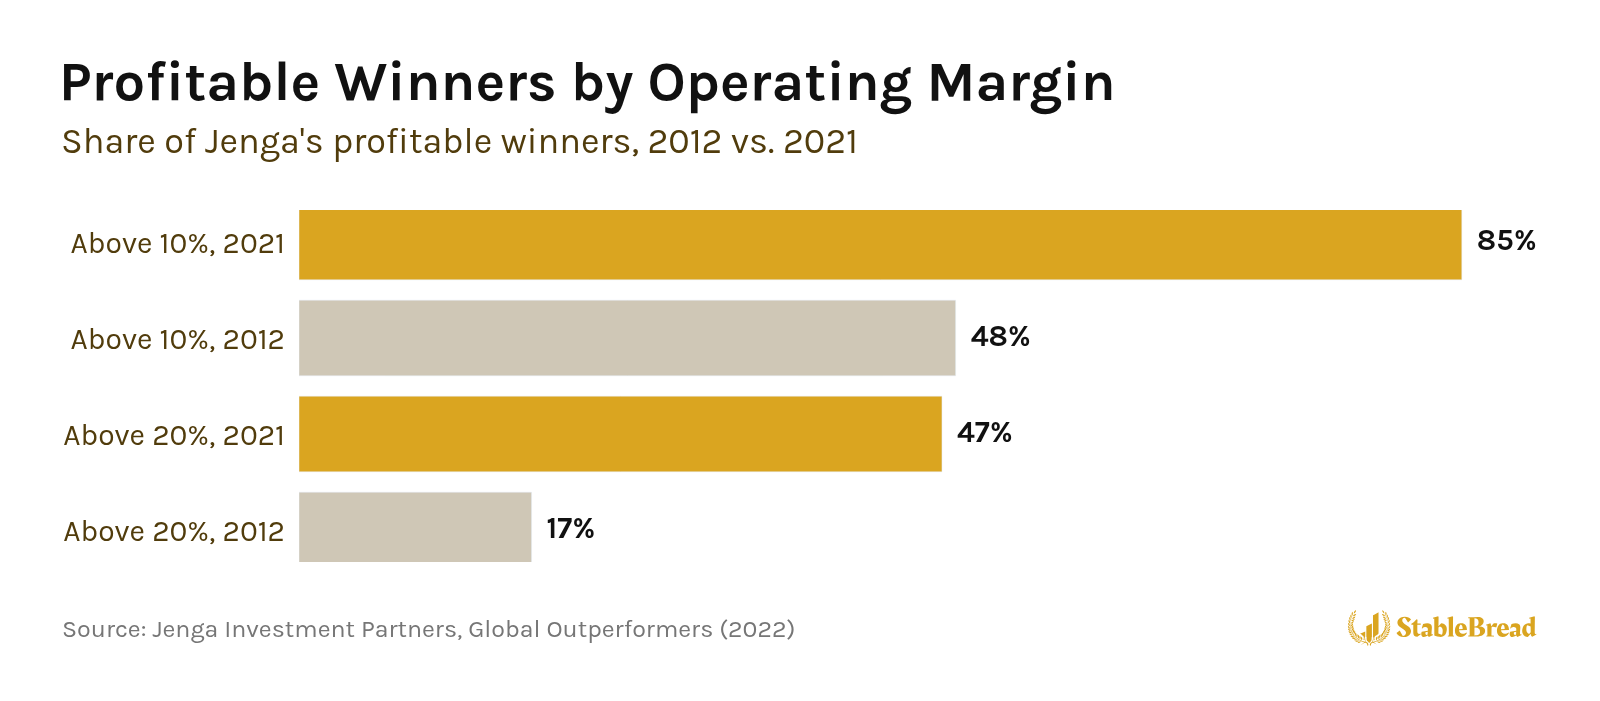
Jenga also found that 74% of its profitable winners grew their earnings faster than their sales. Yartseva’s winners did the same, growing their median operating profit 17.3%/year from 2009 to 2024, vs. 11.1% for sales.
Moats and Reinvestment
To keep margins high for years, Mayer says a company needs a moat, meaning an advantage that keeps competitors out. One sign he looks for is gross margins well above the rest of the industry.
His most important principle is reinvestment, meaning a high return on the money a company reinvests into the business, with room to keep reinvesting at that rate for years, because returns compound over time. For example, $100 compounding at 20%/year grows to ~$620 in 10 years, and to $10,000 in ~25 years.
Home Capital Group, a Canadian mortgage lender, is one of his examples. Home Capital Group’s ROE was between 20.7% and 31.8% every year from 1998 to 2012, and its stock rose 49x over the 16 years to January 2014.
Yartseva’s data disagrees here. Her winners started with a 9% ROE, and in her models, ROE didn’t predict the following year’s return at all.
What did matter was how fast a company grew its assets compared with its profits. Yartseva split her winners into groups by size, book-to-market and profitability, and within each group, compared the companies that grew their assets quickly with those that didn’t. The fast growers did better the following year in all 24 of those comparisons.
However, in her models, when assets grew faster than EBITDA (operating profit before depreciation and amortization), the following year’s return was 4-11% lower. So the winners invested heavily, but only as fast as their profits grew.
Owner-Operators
Mayer also prefers companies run by their owners, like MTY, whose president owned 29% of the company. He cites a 2012 study by two business professors that found companies run by billionaires beat the market by 7%/year.
Jenga found that insiders owned more than 5% of the shares at 67% of its winners, vs. 49% of companies reporting insider ownership, although the report says the gap doesn’t say much on its own. Yartseva didn’t test insider ownership.
What Didn’t Matter
Several measures investors watch closely predicted nothing in Yartseva’s models, including dividends, debt levels, buybacks and R&D spending. Jenga found the same with debt. Tesla (TSLA), the electric car maker, and Celsius (CELH), the energy drink maker, both had debt worth more than 75% of their capital in 2012, and both still rose more than 100x by 2022.
When to Buy and How Long to Hold
Yartseva found that her winners did better the following year when they were bought near their 12-month low, especially after falling over the previous six months. Granted, every stock in her sample went on to rise at least 10x by 2024, so for those stocks, a dip was always a chance to buy cheaper. For a stock that’s falling as you read its chart, nobody knows yet whether it’ll be one of the winners.
Mayer sees it differently. He says many great stocks spend most of their time near their highs, and that you could have bought Monster in 2004 and still made 100x your money. He also found 187 stocks you could have bought from 1966 to 1982 that went on to rise 100x, even though the Dow went nowhere over those 17 years.
Jenga gives the example of ANTA Sports, a Chinese sportswear maker. Investors who bought it at its September 2010 peak still earned 21.3%/year over the next 11 years. So for a company that kept growing, buying at the top still paid off.
Yartseva also found that after the Fed raised interest rates, her winners’ returns over the following year were ~10% lower. Even so, they beat the S&P 500 on average, whether rates were rising or not.
Mayer’s advice is to ignore the Fed and economic forecasts altogether. Both authors can be right, because Yartseva’s models predicted the next 12 months, while Mayer is talking about holding a stock for decades.
Years, Not Months
Mayer found that his 100-baggers took 26 years on average to rise 100x, and only 20 of the 365 did it in less than 10 years:
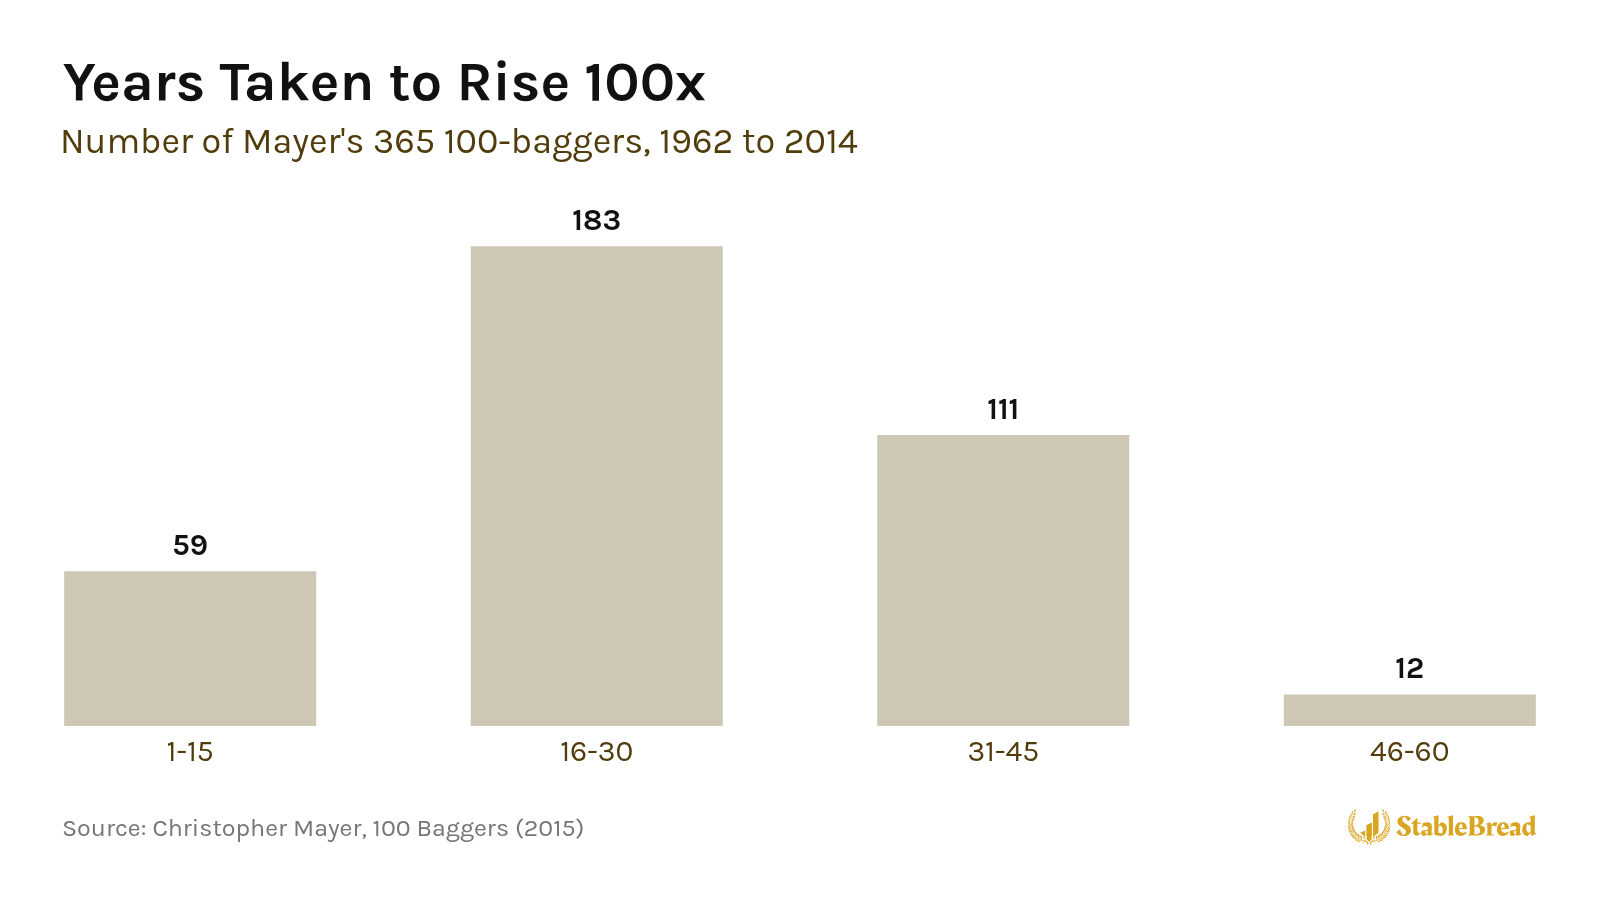
Yartseva’s median winner took 107 months, or ~9 years, to rise 10x, although her 10 fastest needed a median of just 7.5 months.
Jenga’s report notes that the average holding period for stocks has fallen from 8 years to just 5.5 months over the past 60 years. So most investors don’t hold a stock anywhere near long enough for winners like these to pay off.
Several of Jenga’s winners did nothing for years, like Lasertec. From 2005 to 2012, M3, which runs a website for doctors in Japan, grew ~30%/year with operating margins above 40%, but its stock returned nothing because investors had paid 250x its earnings in 2005.
ChemoMetec, a Danish maker of cell counters, also returned nothing from its 2006 IPO to 2015, after investors paid 296x its operating profit. Then demand for cell-based therapies grew quickly, and from May 2012 to May 2022, its share price rose more than 200x.
Even the biggest winners crashed along the way. Apple rose 225x from its 1980 IPO to 2012, even though it fell 80% twice. Monster’s stock fell 25% or more at least 10 times during its run, and Amazon’s fell more than 80%.
Coffee Can Portfolio
Robert Kirby, a portfolio manager at Capital Group, described a way to hold winners through big drops in 1984. He called it the coffee can portfolio, after the coffee cans people in the Old West kept their valuables in.
In the 1950s, one of his clients inherited her late husband’s portfolio. He had invested ~$5,000 in each stock Kirby’s firm recommended and ignored every recommendation to sell. One stake in Haloid, the company that became Xerox, had grown to $800,000, more than her entire account, which Kirby had been managing the whole time.
So simply holding every stock his firm recommended beat Kirby’s own active management of her account.
Related: How the Coffee-Can Portfolio Strategy Captures 100-Bagger Returns
That’s only one example, and most investors would probably consider selling if a stock fell more than 80%. Jenga adds that holding for the long term also doesn’t mean holding forever. Only 18% of the stocks that rose more than 11x from 2002 to 2012 went on to rise more than 500% over the next 10 years.
That’s why Jenga suggests holding cyclical companies for 3-5 years and steady compounders for 5-10 years.
What All Three Studies Agree On
Jenga built a screen from the traits most of its winners shared, to see how many of those winners the screen would have caught before they rose.
The screen kept companies worth less than $300M, valued at less than 1.5x their sales and 10x their operating profit. Jenga even let the screen see the future, keeping only companies whose earnings grew at least 15%/year.
That screen still would have missed 54% of the stocks that rose more than 11x. Jenga also doesn’t say how many companies passed the screen and never rose at all.
Mayer comes to a similar conclusion. He says there’s no formula or simple screen that finds 100-baggers.
Yartseva is more hopeful. She says her models lay the groundwork for future stock screens to identify potential multibaggers, but her paper doesn’t test one on stocks that didn’t win.
Still, all three studies agree on four things about the winners:
- They started small: Most of the winners were worth a few hundred million dollars or less, not billions.
- Their margins widened: Their profits grew faster than their sales, so they kept more of each dollar of sales as profit.
- They started cheap for their growth: Their starting price was low compared with how fast they went on to grow, which left room for investors to pay more later.
- They took years: Most took years to pay off, usually with big drops along the way.
Where they disagree is mainly on four questions:
- ROE and earnings growth: Mayer builds on high returns on reinvested capital and growth, while neither ROE nor past growth predicted the following year’s return in Yartseva’s models.
- When to buy: Yartseva’s winners did best when bought near a 12-month low, while Mayer says great stocks spend most of their time near their highs.
- Interest rates: After Fed rate hikes, Yartseva’s winners returned ~10% less the following year, while Mayer says to ignore the Fed.
- How long to hold: Mayer’s 100-baggers took 26 years on average, while Jenga suggests 3-10 years, depending on the business.
As Mayer puts it in his book:
“A 100-bagger is the product of time and growth.”
— Christopher Mayer, 100 Baggers
