

Since 1970, the U.S. has had eight recessions. Seven of them began while the Fed’s policy rate, after subtracting inflation, was above 1%. The exception was 2020, when the recession began as COVID lockdowns spread:
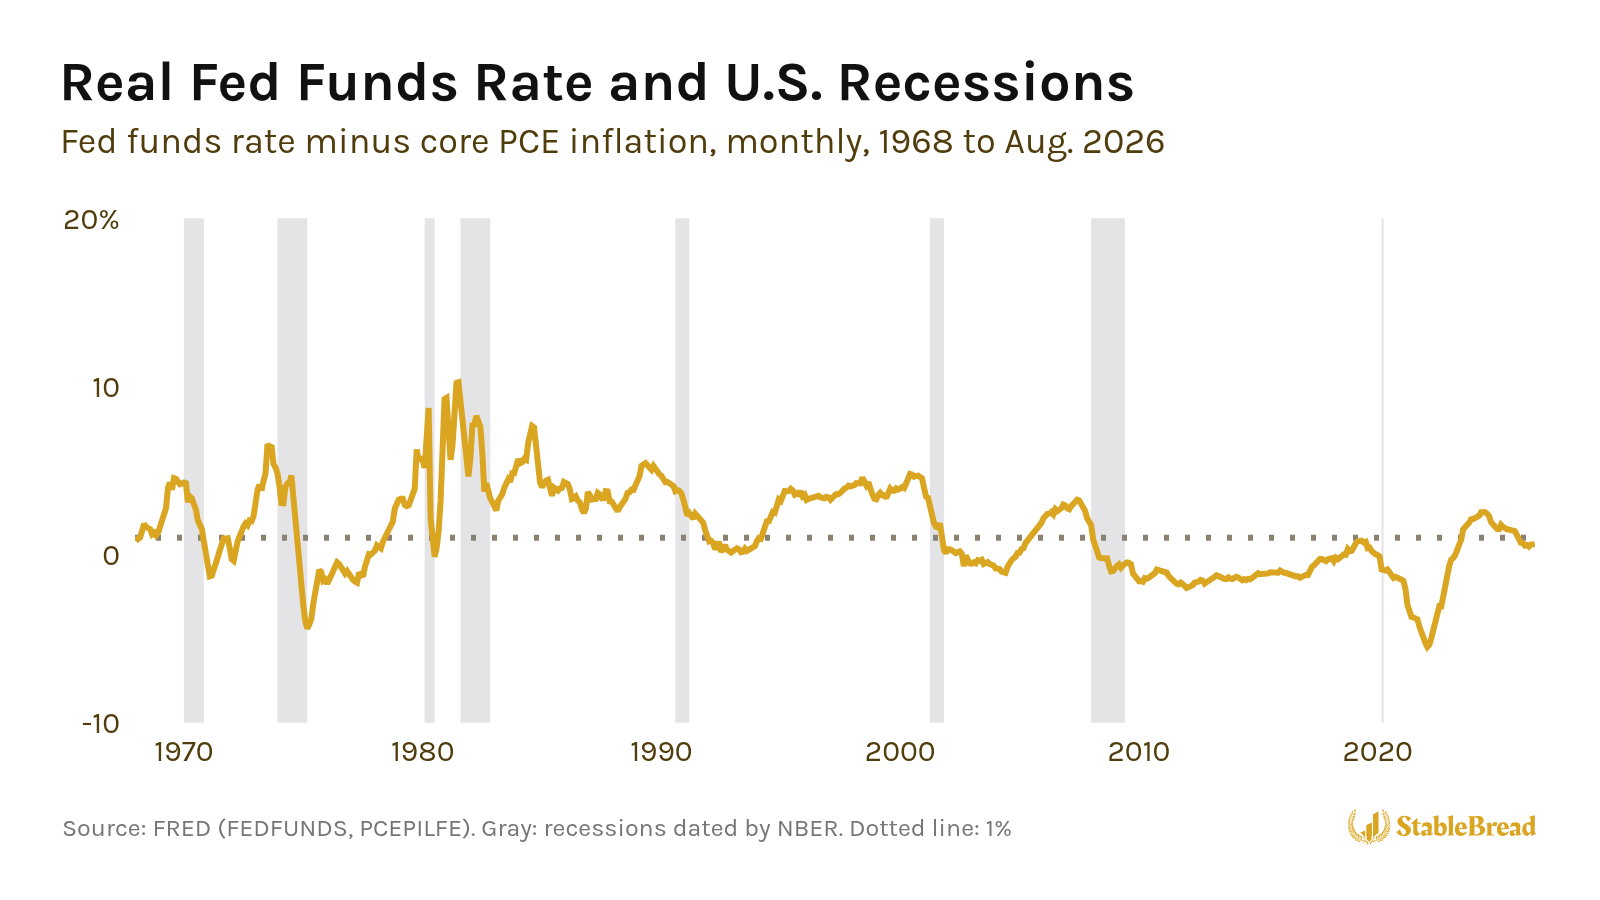
In 2022, the Fed raised rates seven times, but its policy rate stayed below inflation the whole year. The Fed’s rate finally rose more than 1% above inflation in August 2023, the first time since January 2008.
I built a simple map that shows whether the Fed’s rate is high enough to slow the economy, and what that means for your portfolio. The map is called Growth × Policy, and it places the economy in one of four phases using two readings: a growth score built from two monthly economic reports, and how far the Fed’s rate sits above or below inflation. Growth × Policy also describes what to own and what to avoid in each phase.
As of October 10, 2026, the map places the U.S. in a risk-on phase. The growth score is positive, and the Fed’s rate is less than 1% above inflation, which the map reads as not yet high enough to slow the economy.
If you’re deciding when to lean toward stocks and high-yield bonds, and when to move toward cash and long-term Treasuries, the map gives you a framework for the call. Below, I’ll cover where the idea comes from, how each reading works, what each phase says to own, and where the map stood as of October 10, 2026.
Where the Idea Comes From
I built Growth × Policy on two well-known ideas from economics.
Investment Clock
The first is the Investment Clock, which Trevor Greetham and Michael Hartnett published at Merrill Lynch in 2004.
The Investment Clock splits the economy into four phases using two questions. Is real GDP, the economy’s output after inflation, growing faster or slower than the pace it can sustain over time? And is inflation rising or falling?
Each of the four phases has a name and an asset class:
- Reflation: Growth is slow and inflation is falling. Pairs with bonds.
- Recovery: Growth is fast and inflation is still falling. Pairs with stocks.
- Overheat: Growth is fast and inflation is rising. Pairs with commodities.
- Stagflation: Growth is slow but inflation is still rising. Pairs with cash.
Related: How to Position Your Portfolio Using the Four Quadrants Framework
Neutral Interest Rate
The second is the idea of a neutral interest rate, the level of interest rates, minus inflation, that neither speeds the economy up nor slows it down.
In Discretion Versus Policy Rules in Practice (1993), Stanford economist John Taylor built his policy rule, now called the Taylor rule, around a neutral rate of 2% above inflation.
In 2001, Fed economists Thomas Laubach and John Williams published a model that estimates the neutral rate from data on output, inflation, and interest rates, instead of assuming a fixed number. The New York Fed still publishes an updated version of the estimate every quarter.
Get Our 50-Question Stock Analysis Checklist!
After researching hundreds of stocks, we built this 50-question checklist to guide your analysis and help you avoid costly mistakes.
Download ChecklistGrowth Score
Growth × Policy combines two readings, and the first is a growth score. The growth score doesn’t rely on GDP numbers, which come out only once a quarter. Instead, the growth score comes from two monthly reports.
ISM Services PMI
The first is the ISM Services PMI, short for purchasing managers’ index. The PMI surveys the managers who buy supplies for U.S. services companies, from retailers to banks to hospitals, and asks whether their business activity, new orders, and hiring rose or fell from the month before.
The Institute for Supply Management treats 50 as the line between expansion and contraction, and in September 2026, the index came in at 54.9.
Industrial Production
The second is industrial production, the Federal Reserve’s monthly index of output at factories, mines, and utilities.
From 1972 to 2019, industrial production grew ~2%/year on average, so I set its benchmark at 2%. In August 2026, it was up 1.4% from a year earlier.
How the Score Works
Growth × Policy scores each report against its benchmark, ISM against 50 and industrial production against 2%, adjusts for how much each one usually swings, and averages the two:
Growth score = [(ISM − 50) / 3.5 + (IPy/y − 2) / 5.5] / 2
where:
- ISM = ISM Services PMI
- IPy/y = industrial production growth from a year earlier, in %
- 3.5 and 5.5 = ~each series’ historical standard deviation
A score above zero means the two reports, taken together, are beating their benchmarks, which the map labels growth above trend. A score below zero is growth below trend.
Averaging the two reports keeps one weak series from flipping the score on its own. Industrial production was below its level a year earlier for 23 straight months, from April 2015 to February 2017:
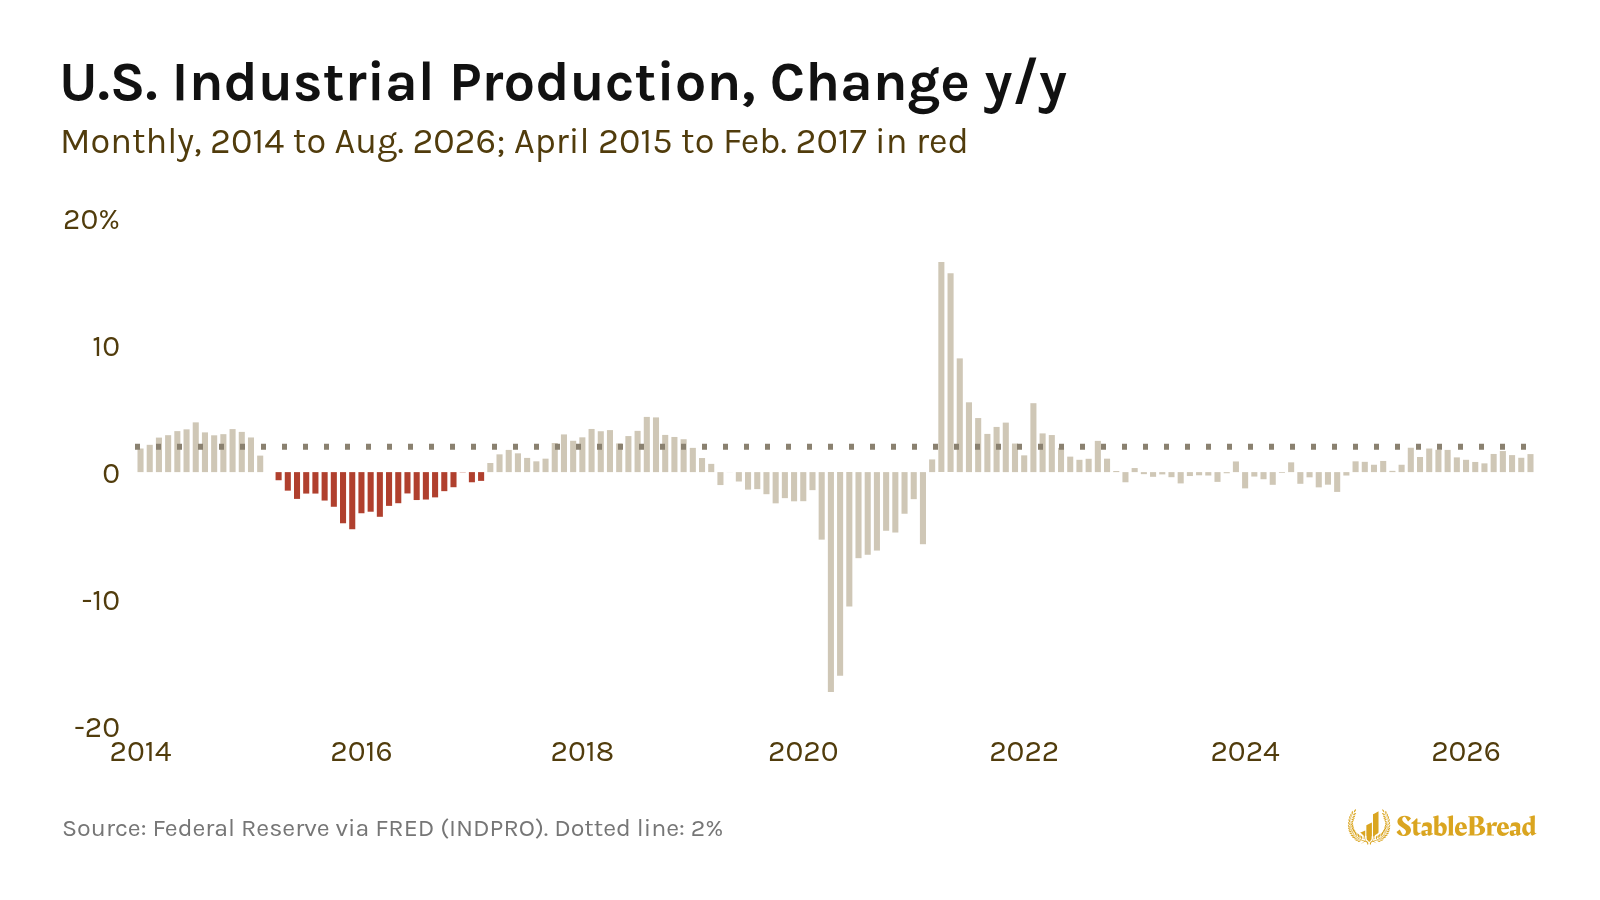
On its own, industrial production would have put the growth score below zero for all 23 months. But the ISM services index stayed above 50 the entire time (its lowest reading was 51.4, for August 2016), and the U.S. never fell into a recession.
Real Fed Funds Rate
Growth × Policy’s second reading is the Fed’s interest rate after subtracting inflation. If you take the federal funds rate, the overnight interest rate the Fed targets, and subtract core PCE inflation, a measure of consumer price increases that strips out food and energy, you get what economists call the real fed funds rate:
Real Fed Funds Rate = Federal Funds Rate − Core PCE Inflation (y/y)
The Fed’s 2% inflation target is set on the PCE price index, and Fed officials watch the core version because food and energy prices jump around.
Level Matters, Not the Hikes
For Growth × Policy, what counts is the level of the real fed funds rate, not whether the Fed is hiking. In December 2022, the fed funds rate averaged 4.1%, but core inflation was 5.1%, so the real rate was still below zero:
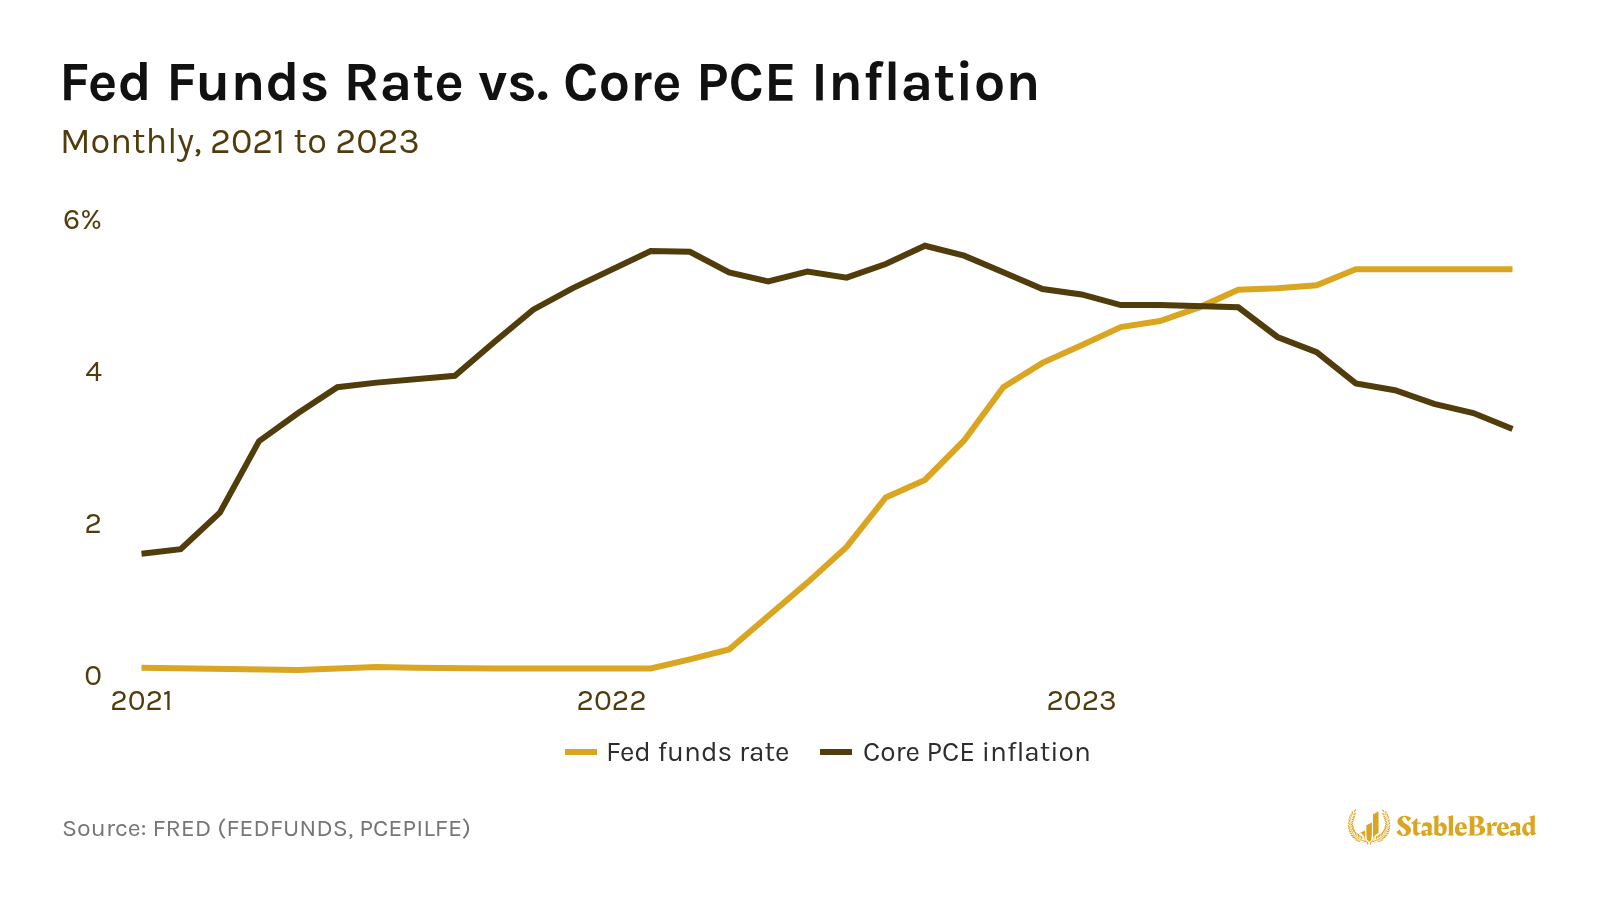
The fed funds rate didn’t rise above core PCE inflation until May 2023, more than a year after the Fed started hiking.
Neutral Rate Estimate
Growth × Policy treats a real rate of 1% as neutral. That’s the New York Fed’s latest estimate of the U.S. neutral rate (1.01% for Q2 2026), released in August 2026:
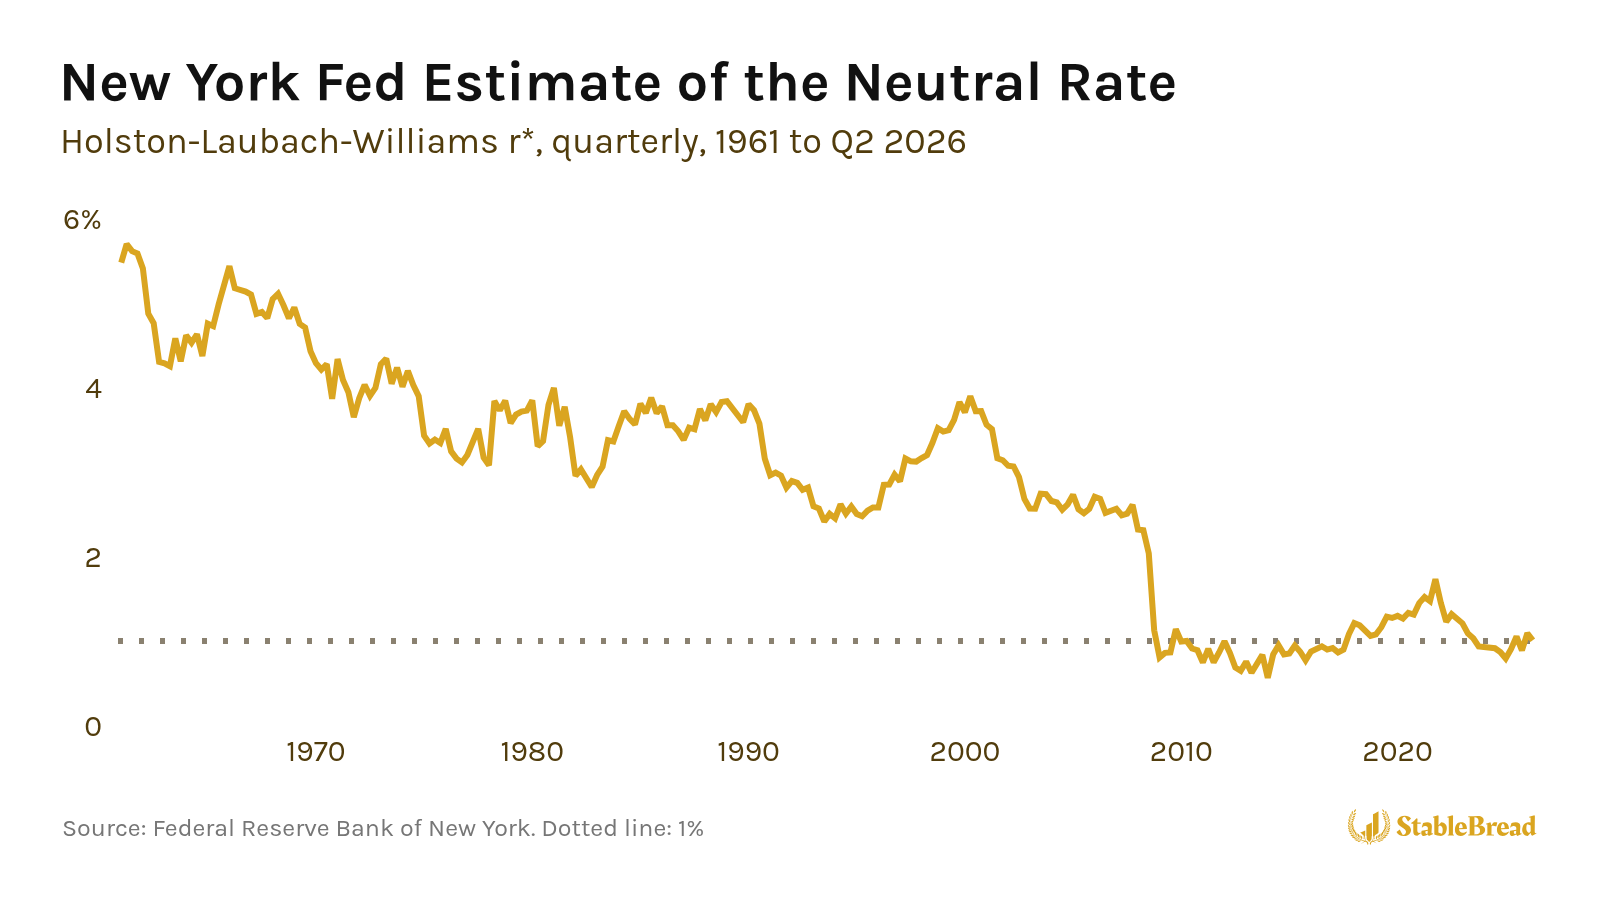
So when the real rate is above 1%, it’s high enough to slow the economy, which economists call tight policy. When the real rate is below 1%, it gives the economy a push, which economists call easy policy.
Nobody can measure the neutral rate directly, so estimates shift with the model and the data. Since 2010, the New York Fed’s estimate has ranged from ~0.6% to ~1.7%.
Seven of the eight recessions since 1970 began while the real fed funds rate was above 1%, but a real rate above 1% doesn’t always lead to a recession. Since 1980, the real rate has been above 1% a little more than half the time (289 of 560 months through August 2026), including every month from 1995 to 1999, and the next recession didn’t start until 2001.
Four Phases
Like the Investment Clock, Growth × Policy asks two questions. Is the growth score above or below zero? And instead of asking about inflation, is the real fed funds rate above or below 1%?
The answers place the economy in one of four phases, shown here as the map appears on my macro dashboard:
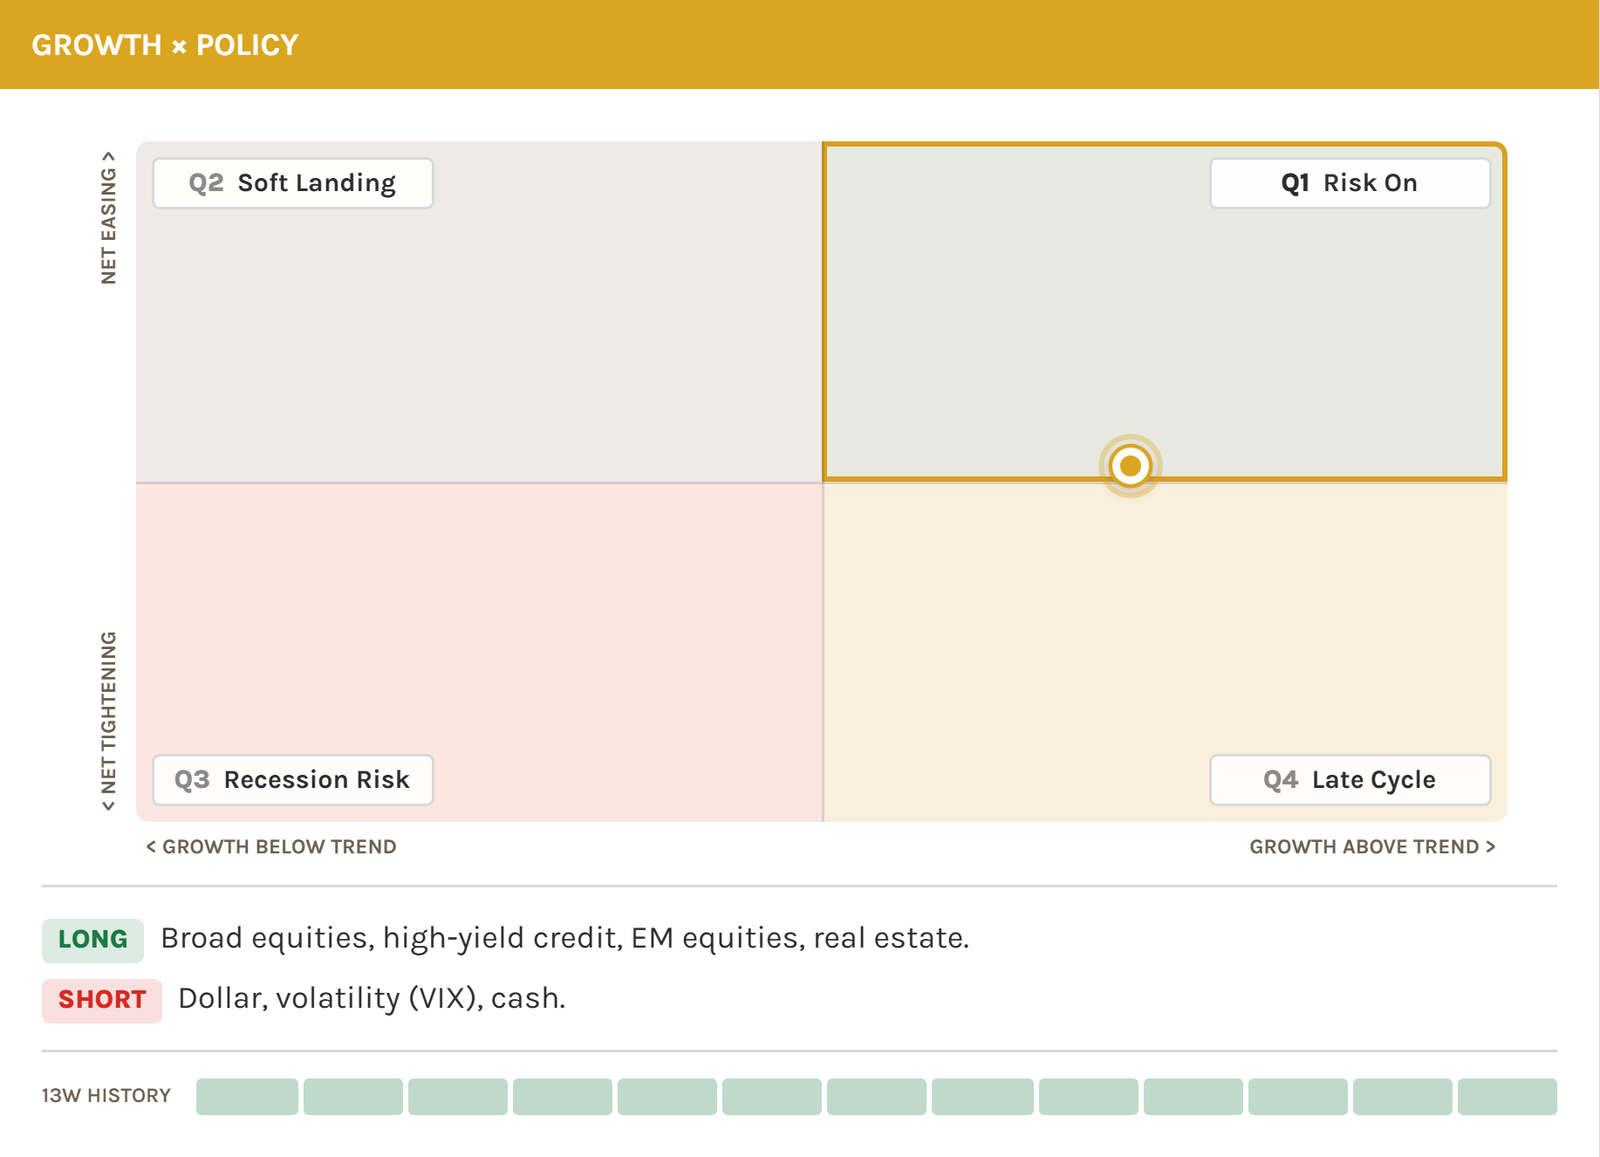
1. Risk On (Top Right)
Risk On is where the growth score is above zero and the real fed funds rate is below 1%. Risk On is the phase to own the broad stock market, high-yield bonds, emerging market stocks, and real estate, and to avoid the dollar, volatility, and cash.
Volatility here means positions that gain when the VIX rises. The VIX is an index built from S&P 500 option prices, and it tends to spike when stocks fall sharply. Strong growth with cheap money tends to lift riskier assets, while cash and safe havens lag.
2. Late Cycle (Bottom Right)
Late Cycle is where the growth score is above zero but the real fed funds rate is above 1%. Late Cycle is the phase to own commodities, value stocks, emerging market stocks, and banks, and to avoid long-term Treasuries and growth and tech stocks.
Strong demand supports commodity producers and cyclical companies, and banks tend to earn wider lending margins when rates are high. Meanwhile, a high real rate weighs on assets whose value depends on cash flows far in the future.
3. Recession Risk (Bottom Left)
Recession Risk is where the growth score is below zero and the real fed funds rate is above 1%. Recession Risk is the phase to own the dollar, cash, and volatility, and to avoid the broad stock market, high-yield bonds, and emerging market stocks.
Slowing growth with a high real rate raises the risk of defaults and earnings cuts, so the assets to own here are mostly protection.
4. Soft Landing (Top Left)
Soft Landing is where the growth score is below zero and the real fed funds rate is below 1%. Soft Landing is the phase to own long-term Treasuries, high-quality growth stocks like large-cap tech, and investment-grade corporate bonds, and to avoid cyclical stocks, emerging market stocks, and industrial commodities.
A low real rate with slower growth tends to pull long-term yields down, which helps long-term Treasuries and steady growers more than cyclical companies.
Where Inflation Fits
Inflation isn’t on either axis, but the map tracks inflation with its background color. When core PCE inflation is 2.5% or higher, 0.5% above the Fed’s 2% target, the background turns a faint orange. Below 2.5%, it turns blue.
Related: How to Protect Your Portfolio Against Inflation
Reading the Map on the Dashboard
I built Growth × Policy into my free macro dashboard, so you can check where the economy sits without pulling these reports yourself. The panel has six parts:
- Horizontal axis: The growth score, labeled growth below trend on the left, where the score is below zero, and growth above trend on the right.
- Vertical axis: The real fed funds rate, labeled net tightening at the bottom, where it’s above 1%, and net easing at the top, where it’s below 1%.
- The dot: Where the economy sits. The dot’s horizontal position shows the growth score, and its vertical position shows the real fed funds rate against 1%.
- Corner labels: Numbered Q1 to Q4, counterclockwise from the top right. Hover any corner label for a one-line summary of its phase.
- Long and short tags: What to own and what to avoid in the current phase.
- 13 squares: The last 13 weeks, one square per week, so you can see how long the current phase has lasted.
The map updates weekly. ISM, industrial production, and core PCE come out once a month, and the fed funds rate changes when the Fed raises or lowers its target, which it decides at eight scheduled meetings per year.
Where the Map Stood in October 2026
As of the dashboard’s October 10, 2026 update, the map places the U.S. in a risk-on phase, and all 13 squares are risk on.
The growth score is above zero. The ISM services index came in at 54.9 in September, well above 50, while industrial production grew just 1.4% from a year earlier, below its 2% benchmark. Averaged together, the score still lands above zero.
The Fed raised its target by 0.25%, effective September 17, 2026, which lifted the fed funds rate to 3.88%. Core PCE inflation was 3.0% in August, so the real fed funds rate is ~0.9%:
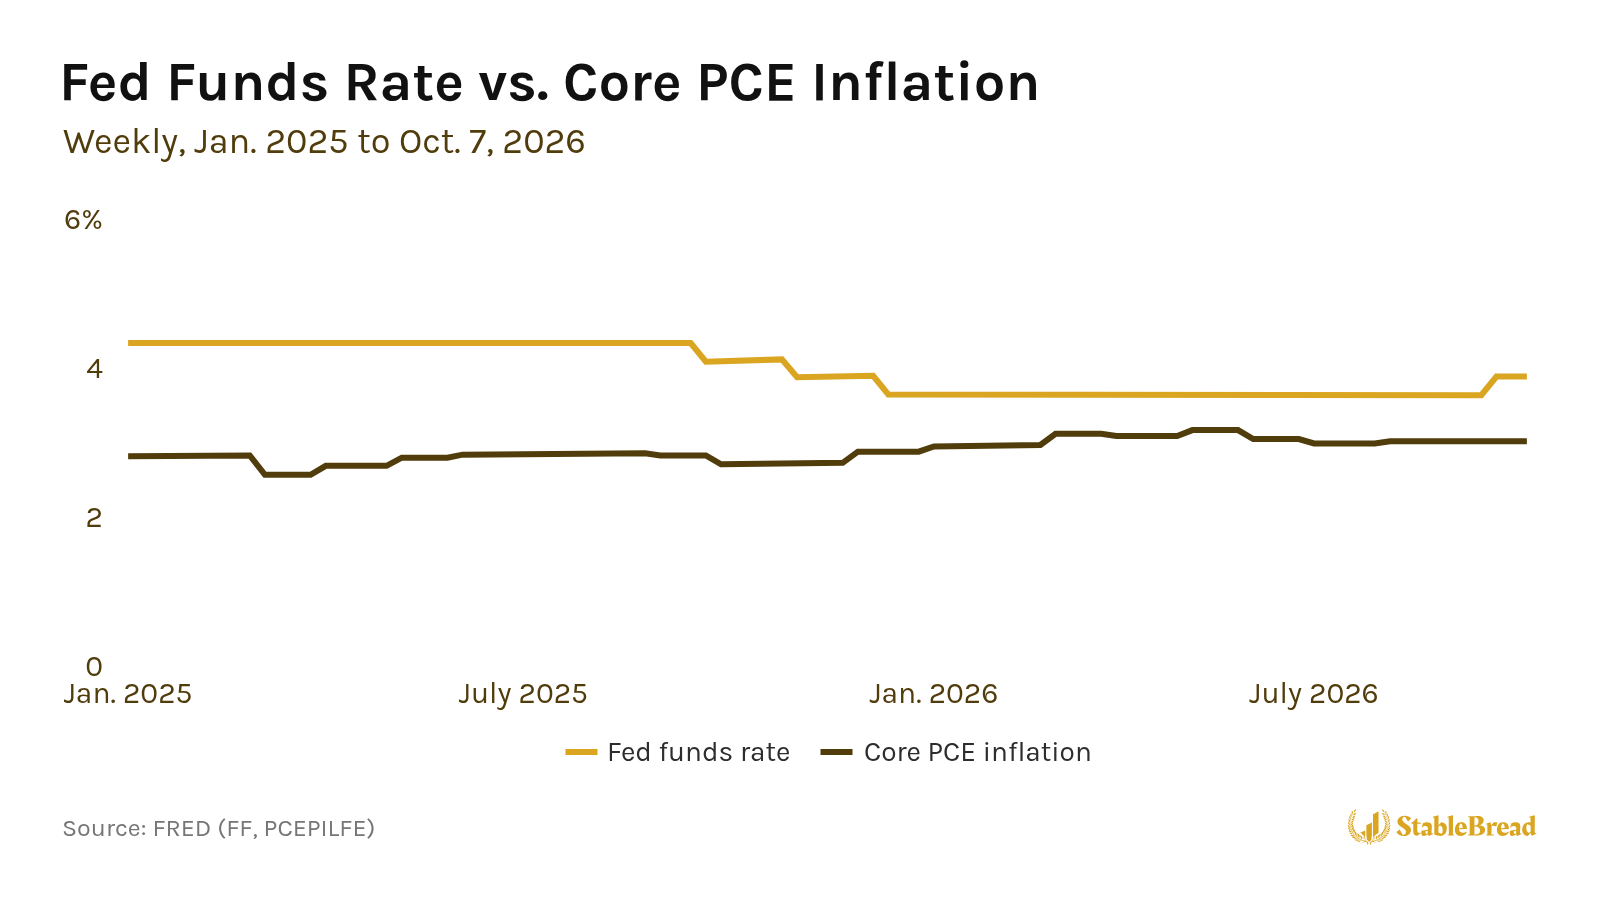
A ~0.9% real rate is ~0.1% below the map’s 1% neutral, so the dot sits just above the horizontal line, in the half labeled net easing. With core inflation at 3.0%, the map has its orange tint.
The long and short tags say to own the broad stock market, high-yield bonds, emerging market stocks, and real estate, and to avoid the dollar, volatility, and cash. A positive growth score, with a real rate that isn’t yet high enough to slow the economy, tends to favor riskier assets over safe havens.
What Would Change the Reading
Two developments would move the dot out of risk on:
- Down into late cycle: If the fed funds rate stays at 3.88% and core inflation falls below ~2.9%, the real rate rises above 1%. Another hike of the same size, with core inflation at 3.0%, would do the same.
- Left into soft landing: If the ISM services index falls toward 50 while industrial production stays weak, the growth score drops below zero.
Each new ISM, industrial production, and core PCE report, and each Fed decision, updates the dot on the dashboard, so you can see which way the economy is heading as the data comes out.
