

Long-term Treasuries returned 22% in the first three months of 2020, while high-yield bonds, the debt of riskier companies, lost ~12%.
Then in 2022, both fell together. Long-term Treasuries lost 31%, and high-yield bonds lost 11%, measured by the total returns of the iShares 20+ Year Treasury Bond ETF (TLT) and the iShares iBoxx $ High Yield Corporate Bond ETF (HYG), with interest reinvested:
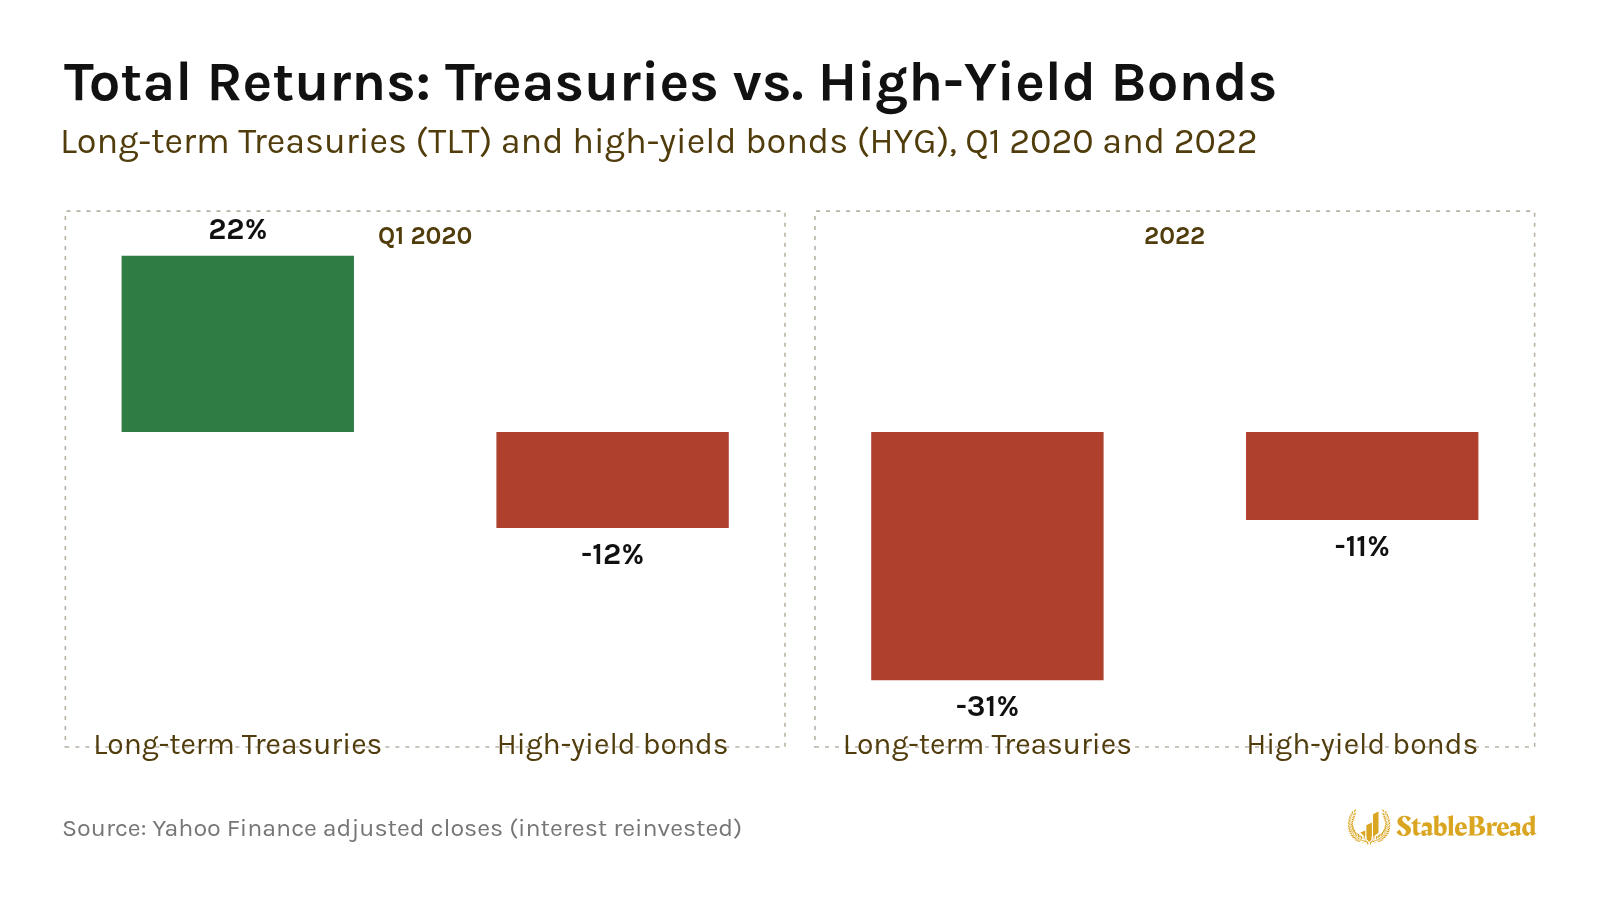
In early 2020, investors feared companies would default, so they sold riskier bonds and bought Treasuries. In 2022, interest rates jumped, which pushed down the price of every kind of long-term bond.
I built a simple map to tell those two risks apart, and I call it Credit × Duration. Credit is the risk that a borrower doesn’t pay you back, and duration measures how much a bond’s price falls when interest rates rise.
Credit × Duration compares two moves over the last 13 weeks, the change in the 10-year Treasury yield and the change in the extra yield riskier companies pay to borrow above what the U.S. government pays, and places the bond market in one of four phases.
If you go back to 2020, the map shows flight to quality, when investors sell riskier bonds and buy Treasuries, for 14 straight weeks from late February to late May. In 2022, it shows bond selloff, when Treasury yields and default fears both rise, for 32 of the 52 weeks.
As of October 9, 2026, the map places bonds in a bond selloff phase. Over the prior 13 weeks, the 10-year Treasury yield rose from 4.56% to 5.22%, and high-yield bonds went from paying 2.69% more than Treasuries to 3.15% more.
If you own bonds or bond funds, the map shows whether interest rates or default fears are moving your bonds. Below, I’ll explain where the idea comes from, how to read each move, what each phase means, and where bonds stood as of October 9, 2026.
Where the Idea Comes From
I built Credit × Duration on research that splits bond risk into two parts.
In Common Risk Factors in the Returns on Stocks and Bonds (1993), economists Eugene Fama and Kenneth French showed that bond returns move with two common forces. One is tied to how long a bond has until it matures, and the other to the risk that its issuer defaults.
Bond investors call the first interest rate risk, and they measure it with duration. The second is credit risk.
Excess Bond Premium
In Credit Spreads and Business Cycle Fluctuations (2012), economists Simon Gilchrist and Egon Zakrajšek built an index of corporate bond spreads, the extra yield companies pay over Treasuries, that helps predict U.S. economic activity.
Gilchrist and Zakrajšek split the spread into the part explained by expected defaults and the rest, which they called the excess bond premium. When that premium jumps for reasons unrelated to the economy, economic activity and asset prices tend to fall.
Stock and Bond Correlation
In 2020, Harvard economist John Campbell and his co-authors, Carolin Pflueger and Luis Viceira, showed that from 1979 to 2001, stocks and Treasuries tended to rise and fall together. From 2001 to 2011, they tended to move in opposite directions.
Campbell and his co-authors’ explanation is the way inflation moved with growth. Before 2001, inflation tended to rise when growth weakened, which hurts stocks and Treasuries at the same time. After 2001, inflation tended to rise when growth was strong, which hurts Treasuries while stocks do well.
Credit × Duration asks a simpler question every week. Are bonds moving because of interest rates, or because of default risk?
Related: How to Position Your Portfolio Using the Four Quadrants Framework
Get Our 50-Question Stock Analysis Checklist!
After researching hundreds of stocks, we built this 50-question checklist to guide your analysis and help you avoid costly mistakes.
Download ChecklistTwo Moves
Credit × Duration tracks two moves, the 10-year Treasury yield for interest rate risk and the high-yield spread for default risk.
10-Year Treasury Yield
The first move is the change in the 10-year Treasury yield, the interest rate investors earn on 10-year U.S. government bonds. On October 5, 2026, the 10-year yield closed at 5.31%, its highest close since May 2002. Here’s how it climbed from 2019 to October 8, 2026:
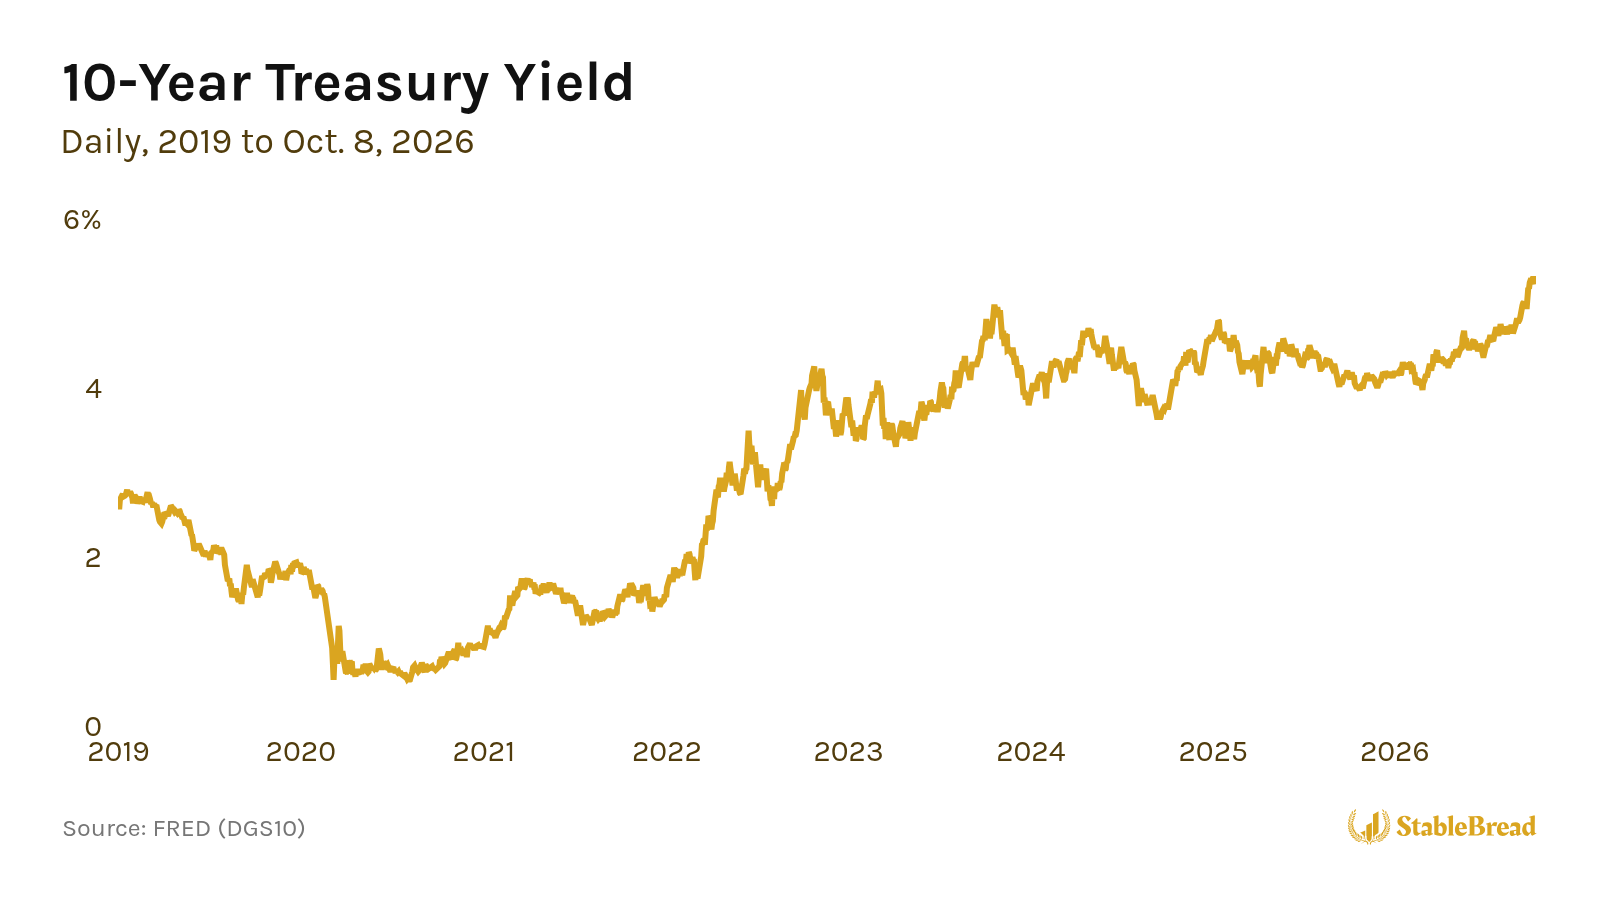
When yields rise, existing bonds lose value, because new bonds pay more. The longer a bond has until it matures, the bigger the loss.
To put a number on that loss, a 10-year Treasury bought at a 5% yield loses ~7% of its price if its yield rises to 6% (a 5% coupon paid twice a year, with the price falling from 100 to 92.56).
High-Yield Spread
The second move is the change in the high-yield spread, the extra yield that companies with junk credit ratings (BB or lower) pay over Treasuries.
When investors worry more about defaults, they demand more yield, and the spread widens. When they worry less, the spread shrinks, which investors call tightening.
Since 2019, the ICE BofA U.S. High Yield Index spread has ranged from 2.59% in January 2025 to 10.87% in March 2020:
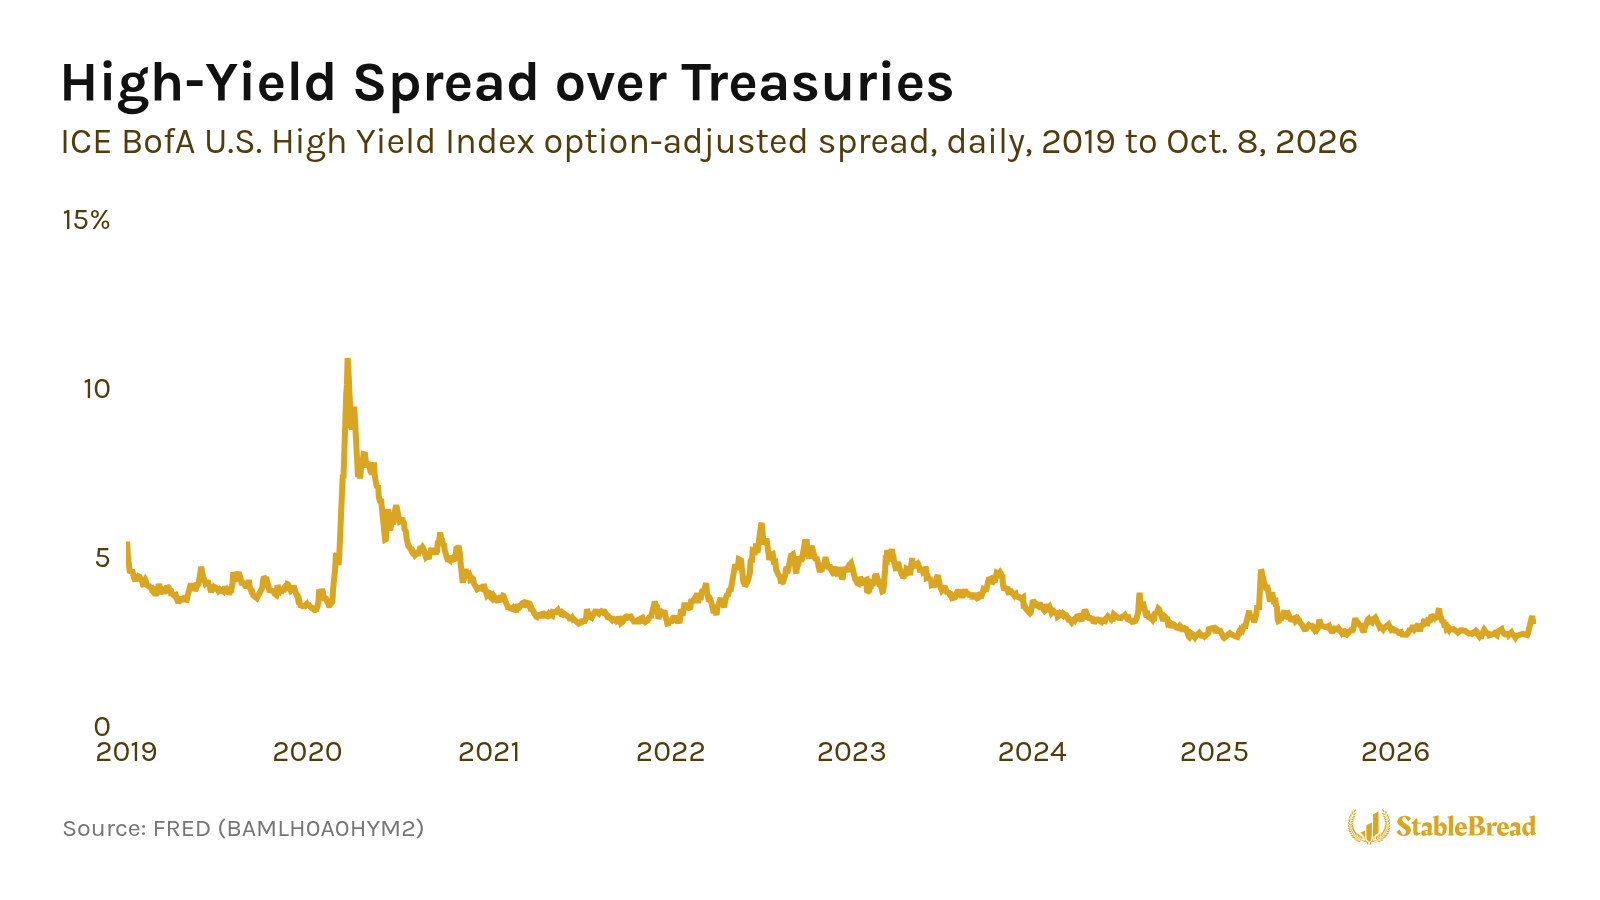
A junk bond’s yield is roughly a Treasury yield plus that spread, so Credit × Duration tracks the two separately, measuring how much each one changed over the last 13 weeks in basis points (hundredths of a percentage point). A yield moving from 5% to 6%, for example, is a 100 basis point rise.
Four Phases
Together, the moves in the 10-year yield and the high-yield spread put bonds in one of four phases. On the map, spreads widen to the left and tighten to the right, while yields fall toward the top and rise toward the bottom:
That layout places the best phase for bond holders in the top right and the worst in the bottom left.
Bond Rally (Top Right)
Bond rally is where the 10-year yield fell and the high-yield spread tightened over the last 13 weeks, so Treasuries and junk bonds both tend to gain.
From late September to late December 2023, the 10-year yield fell 71 basis points, to 3.88%, and high-yield spreads tightened 69 basis points.
Flight to Quality (Top Left)
Flight to quality is where the 10-year yield fell but the high-yield spread widened over the last 13 weeks, as investors sell risky debt and buy Treasuries.
From late December 2019 to late March 2020, the 10-year yield fell 100 basis points, to 0.92%, while high-yield spreads widened 656 basis points, to 10.09%.
Flight to quality also hit in April 2025, after the U.S. announced sweeping new tariffs on April 2. From early January to mid-April 2025, high-yield spreads widened 145 basis points while the 10-year yield fell 29 basis points.
Bond Selloff (Bottom Left)
Bond selloff is where the 10-year yield and the high-yield spread both rose over the last 13 weeks, so Treasuries and junk bonds both tend to lose.
From mid-March to mid-June 2022, the 10-year yield rose 111 basis points, to 3.25%, and high-yield spreads widened 134 basis points, to 5.15%.
Treasury Selloff (Bottom Right)
Treasury selloff is where the 10-year yield rose but the high-yield spread held steady or tightened over the last 13 weeks. Rates are climbing, but investors are worrying less about defaults.
From late December 2020 to late March 2021, as the economy reopened, the 10-year yield rose 73 basis points, to 1.67%, while high-yield spreads tightened 57 basis points.
Time in Each Phase
From April 2019 to early October 2026, the map spent 39% of its weeks in treasury selloff, 24% in bond rally, 19% in bond selloff, and 18% in flight to quality:
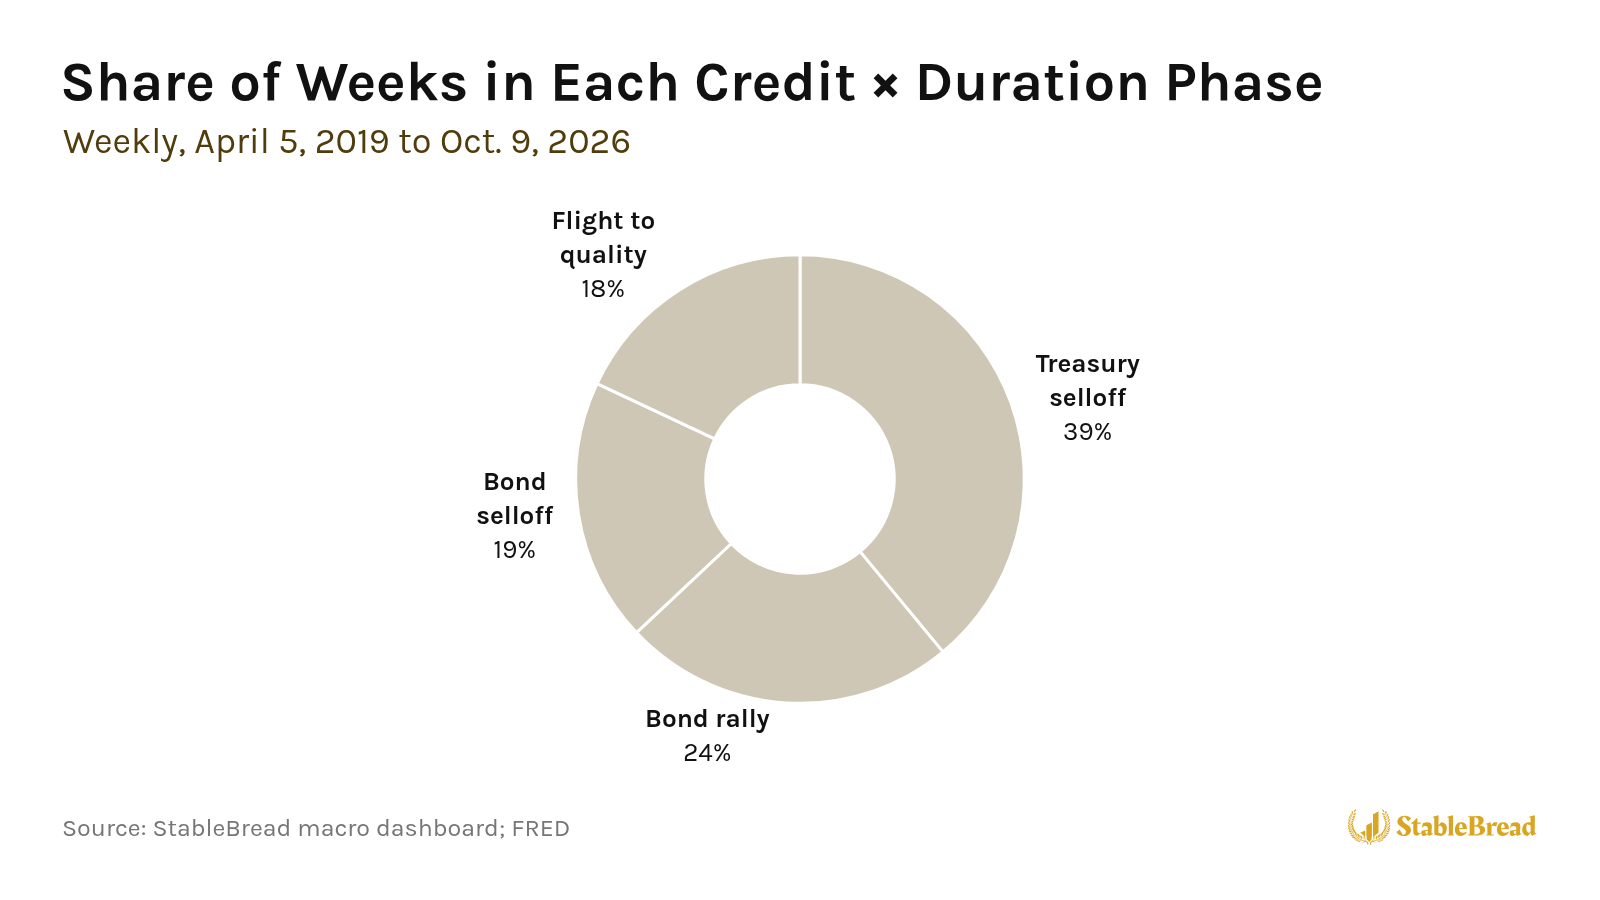
The phase changed 91 times, so each phase lasted ~4 weeks on average.
Note: Credit × Duration describes what the bond market did over the last 13 weeks, not what it will do next. A 13-week change also doesn’t show whether yields are already high or low.
Reading the Map on the Dashboard
I built Credit × Duration into my free macro dashboard, so you can check where bonds stand without rebuilding any of these charts yourself.
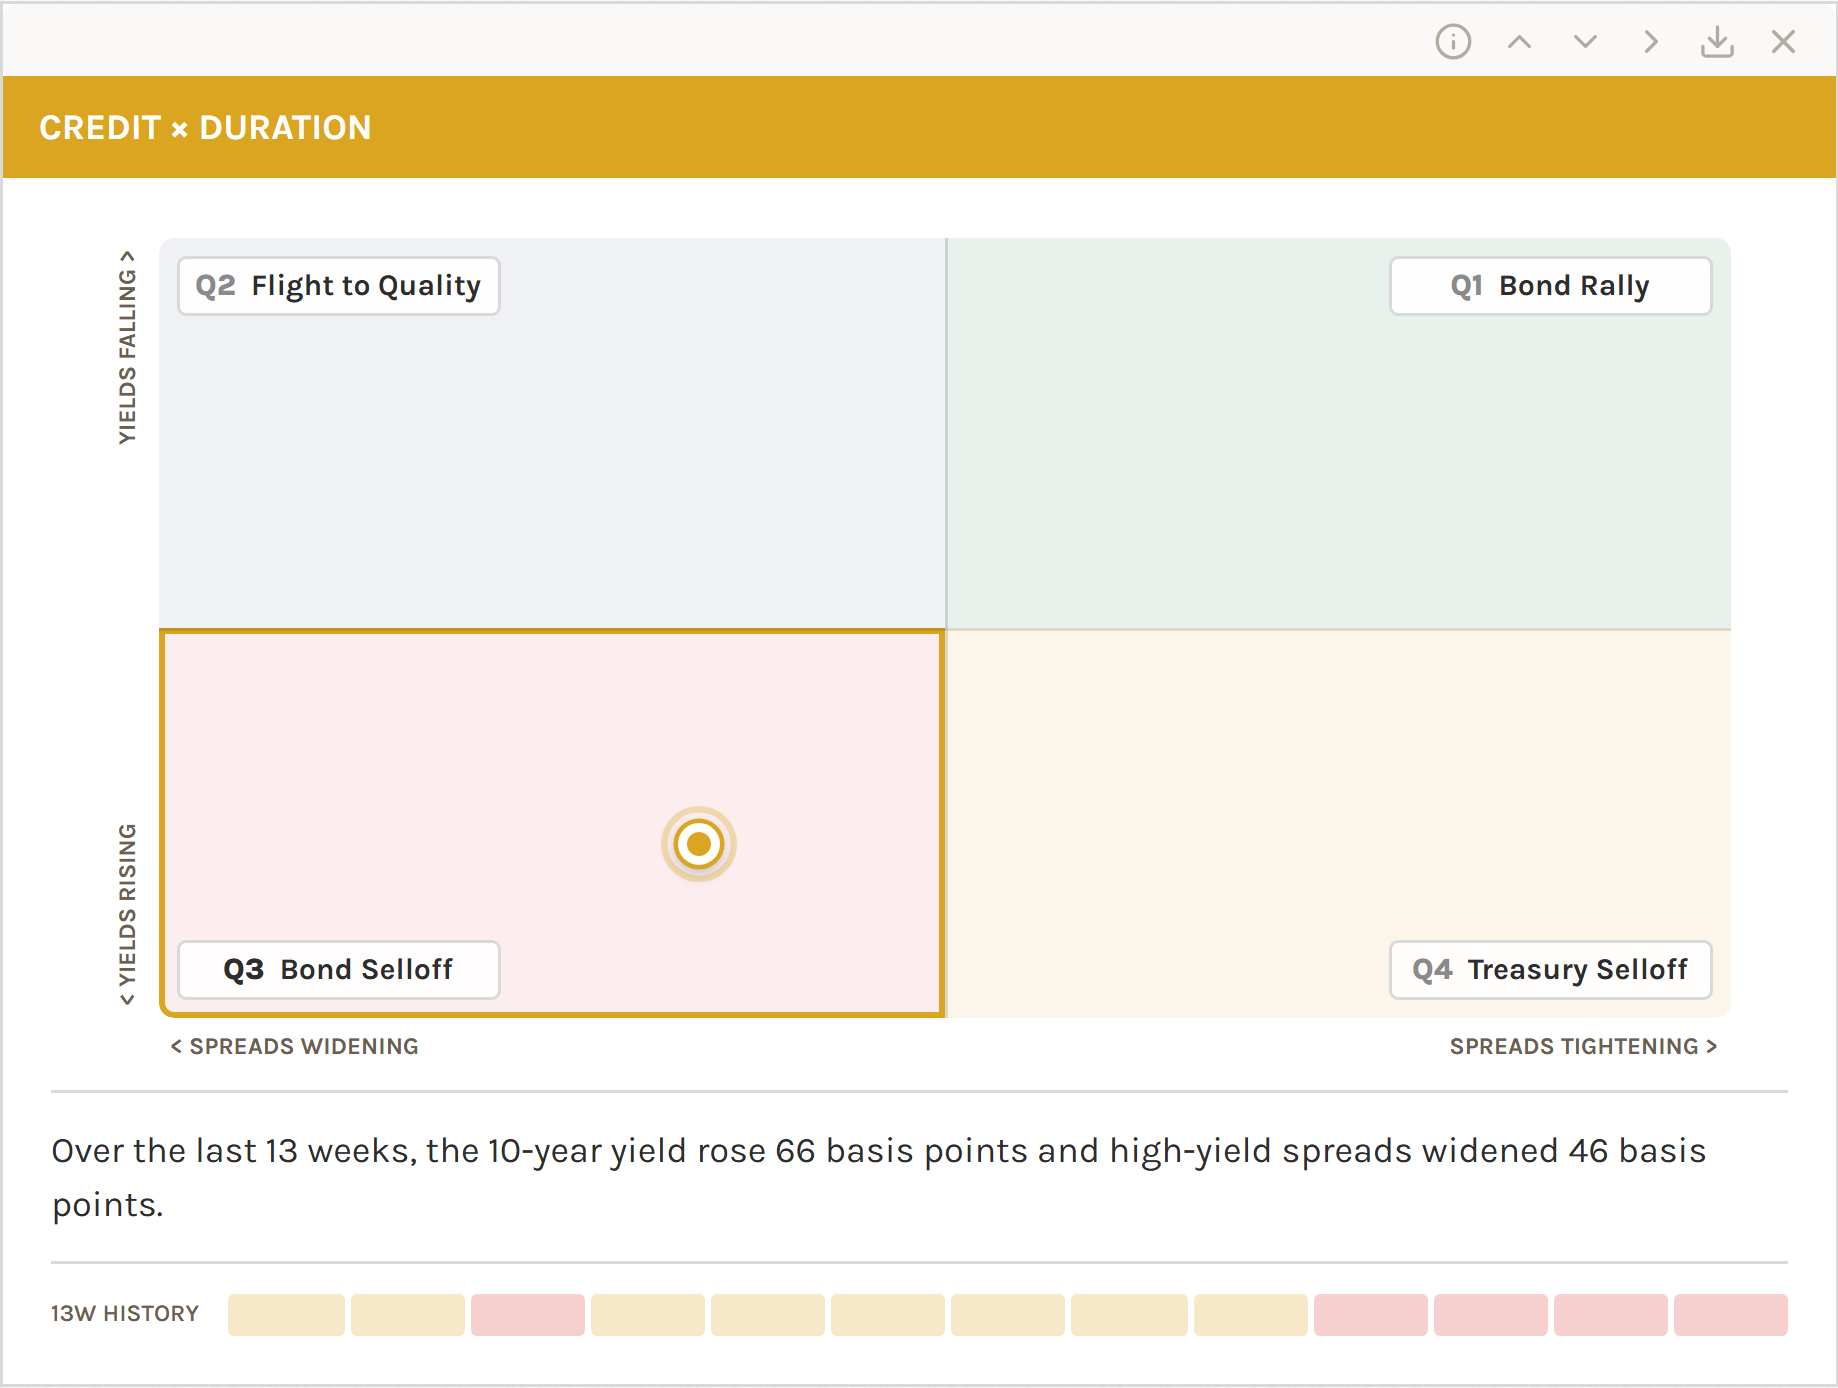
The horizontal axis shows the 13-week change in the high-yield spread, labeled spreads widening on the left and spreads tightening on the right. The vertical axis shows the 13-week change in the 10-year yield, labeled yields falling at the top and yields rising at the bottom.
The dot shows where bonds sit. The dot’s horizontal position shows how much the high-yield spread changed, and its vertical position shows how much the 10-year yield changed, each compared with a typical 13-week move (~42 basis points for the 10-year yield and ~52 basis points for high-yield spreads, measured since 2019). A move twice the typical size reaches the edge.
The corner labels are numbered Q1 to Q4, counterclockwise from the top right, and hovering over a label shows a one-line summary of its phase.
Under the map, one sentence spells out the move in plain numbers, how much the 10-year yield changed and how much spreads changed. When one side clearly drove the move, the sentence starts by saying whether it was Treasury yields or credit spreads.
The squares underneath are the last 13 weeks, one square per week, so you can see whether a phase is brand new or has been building. The map updates weekly, using each week’s last closing 10-year yield and high-yield spread.
Where Bonds Stand Today
As of October 9, 2026, the map places bonds in a bond selloff phase, using October 8’s closes, the latest FRED had posted that week.
Over the 13 weeks from July 10, the 10-year yield rose 66 basis points, from 4.56% to 5.22%, and high-yield spreads widened 46 basis points, from 2.69% to 3.15%.
The sentence under the map names no driver this time, because neither move was at least twice as big as the other, compared with what’s typical for each. The yield move is ~1.6x its typical size, and the spread move is close to its typical size, so the dot sits below and to the left of center, inside bond selloff.
Eight of the last 13 weeks were treasury selloff, with the 10-year yield rising while the high-yield spread held steady or narrowed. The other five were bond selloff, including the last four, as spreads started widening as well.
Even after that widening, the high-yield spread of 3.15% is closer to its January 2025 low of 2.59% than to its March 2020 peak of 10.87%.
From here, two moves would tell you where the dot goes next:
- Spreads keep widening while yields fall: The dot moves up into flight to quality.
- Yields keep rising and spreads keep widening: The dot stays in bond selloff, where Treasuries and junk bonds both tend to lose.
In both cases, the spread keeps widening, so the 10-year yield decides whether bonds get relief in flight to quality or keep losing in bond selloff.
