

If you research and invest in individual stocks, how many stocks should you own in your portfolio?
Own too few, and you’re more likely to miss the handful of stocks that drive most of the market’s returns. Own too many, and each winner makes less of a difference to your overall returns. The right number depends less on a rule of thumb than on how good you are at choosing stocks.
Below, I’ll walk through what the research says about proper diversification, how a few stocks drive most of the market’s returns, and how many stocks some of the most successful investors actually owned.
Then I’ll go through my own scenario where I compared portfolios of 5 to 50 stocks for five kinds of stock pickers, from terrible to legendary. I’ll also share what that means for how many stocks you should own and how much to invest in each.
How Much Risk Each Stock Removes
To measure how much risk each extra stock removes, I selected the 466 stocks in the S&P 500 as of October 2026 that traded the entire time from September 2016 to September 2026. Then I built 5,000 random portfolios of each size, from 1 stock up to 300, with the same amount in each stock.
A single stock carried 30% risk per year, on average. Risk here means standard deviation, which measures how much a stock’s returns swing up and down around their average.
Owning 20 stocks cut that risk to ~17%, and even owning all 466 only cut it to ~16%:
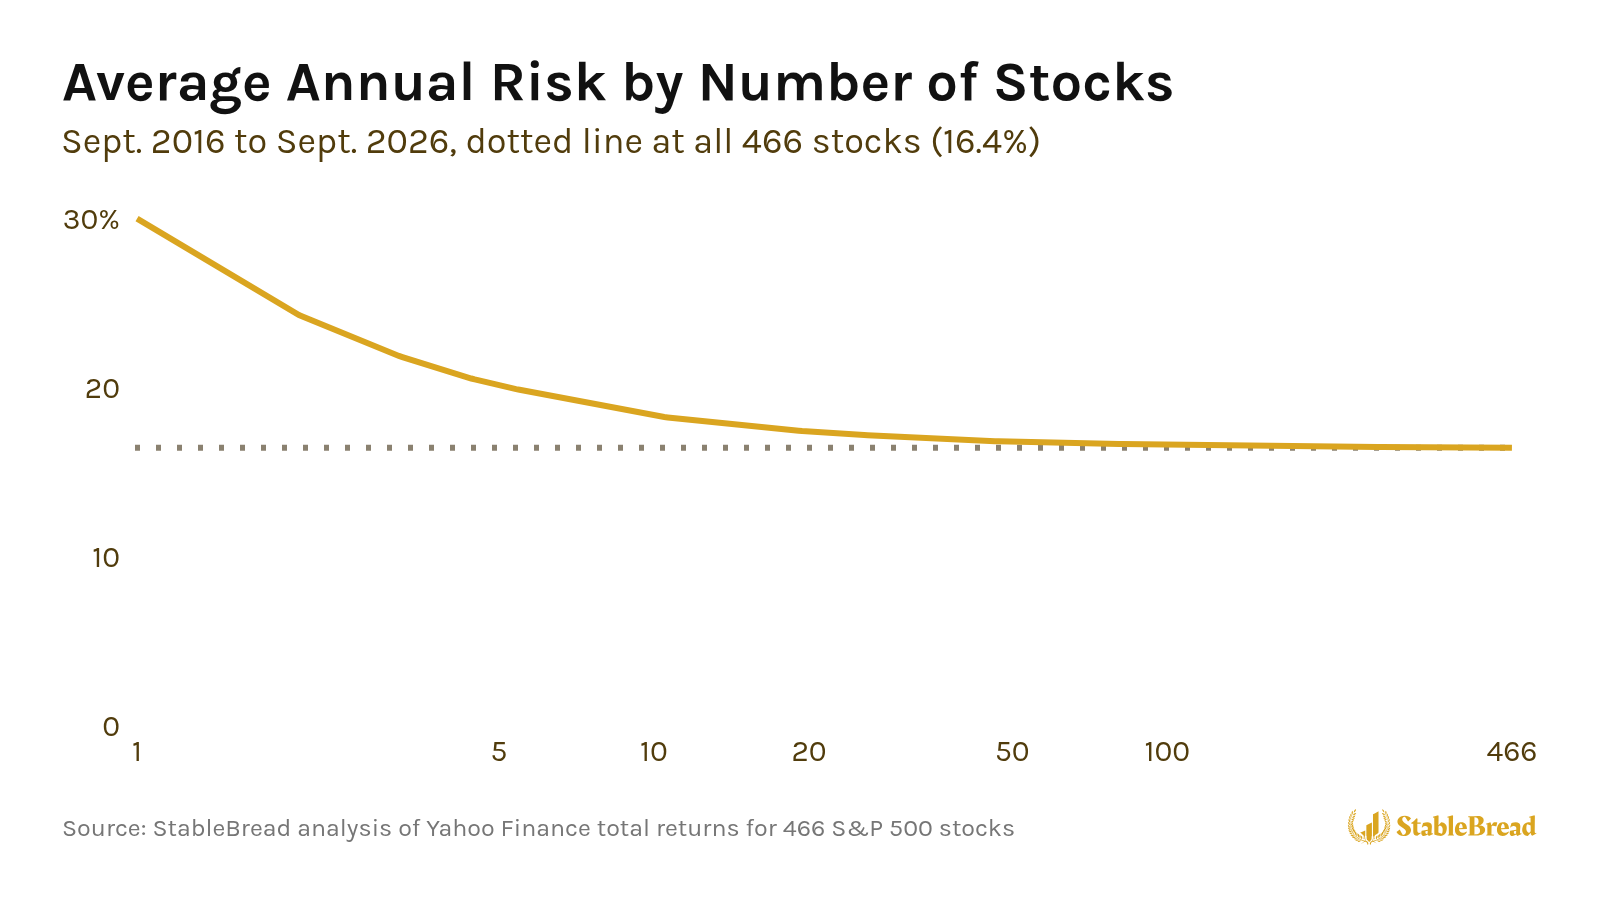
That fits the common rule of thumb that 20 stocks are enough to properly diversify a portfolio.
Note: These returns use Yahoo Finance month-end prices with dividends reinvested, and each portfolio is rebalanced to equal amounts every month. The test excludes Dell, since the only Dell shares that traded before December 2018 tracked its VMware stake.
Systematic vs. Unsystematic Risk
Owning more than 20 stocks barely lowers your risk because every stock carries two kinds of risk:
- Systematic risk: The risk of the entire market falling, like in a recession, which the number of stocks you own can’t reduce.
- Unsystematic risk: Comes from the company itself, like a failed product or an accounting scandal, and that’s the risk you can reduce by owning more stocks.
So with all 466 stocks, the ~16% that’s left is almost all systematic risk.
Related: How to Calculate and Interpret Stock and Portfolio Beta
That idea goes back to 1952, when economist Harry Markowitz proved that a portfolio’s risk depends on how its stocks move together, not just on how many stocks it owns. He later shared the 1990 Nobel Prize in economics for that work.
That’s also why the stocks you own should be in different industries. In the same paper, Markowitz wrote that owning 60 different railroads is less diversified than owning railroads, utilities, mining and manufacturing companies, because companies in the same industry tend to do poorly at the same time.
In my test, the unsystematic risk is the ~14% gap between a single stock’s 30% and the 16.4% for all 466 stocks. With 10 random stocks, the risk fell to ~18%, so 86% of that gap was already gone. With 15 stocks, it was 90%, and with 20 stocks, 93%.
Verdad, a quantitative investment firm, found about the same in a 2023 study of 1995 to 2022, where 20 stocks removed 90% of that gap.
So 10-15 stocks already reduce the unsystematic risk by 86-90%.
However, standard deviation only measures how much your returns swing up and down, not whether you own the few stocks that drive most of the market’s returns.
Get Our 50-Question Stock Analysis Checklist!
After researching hundreds of stocks, we built this 50-question checklist to guide your analysis and help you avoid costly mistakes.
Download ChecklistFew Stocks That Drive Returns
The stocks that drive most of the market’s returns are rarer than you might think. In a 2026 study, Hendrik Bessembinder, a finance professor at Arizona State University, looked at all 29,754 U.S. stocks that traded from 1926 to 2025.
He found that just 4% of companies created all of the stock market’s $91 trillion of gains above Treasury bills, which are short-term U.S. government debt and effectively what’s considered a risk-free investment. Just 46 companies created half of those gains.
The other 96%, taken together, earned about the same as those bills, and more than half of all the stocks lost money over their lifetimes.
Granted, the study follows each stock for as long as it was listed, which for some companies was close to a century, and practically no one holds a stock that long. Still, most stocks trail Treasury bills over shorter periods as well. Since 1986, fewer than half of all stocks (47.9%) have beaten Treasury bills over a 10-year period.
I found a similar pattern in the S&P 500 from September 2016 to September 2026. Nvidia (NVDA) alone turned $1 into $136. If you’d put $1 into each of the 466 stocks, just the 10 best would’ve produced 28% of your total gain, and only 136 of the 466 beat SPY, the S&P 500 ETF.
So owning fewer stocks only pays off if you can find those winners. If you can, owning fewer stocks lets each winner make a bigger difference to your overall returns. If you can’t, owning only a few stocks makes it more likely you’ll miss the winners entirely.
Even professional fund managers get most of their edge from just a few stocks. In a 2021 study by Miguel Antón, Randolph Cohen and Christopher Polk, the stocks fund managers bet on most, which the authors call their best ideas, beat the market by 2.8-4.5%/year. Most of the other stocks in their portfolios didn’t beat the market by a meaningful amount.
Since the typical fund held ~160 stocks, the authors argued that investors would be better off if managers owned fewer stocks and focused on their best ideas.
Related: Why You Should Run a Concentrated Portfolio
How Many Stocks Successful Investors Own
The most successful investors have owned anywhere from a handful of stocks to more than 1,000. I plotted 50 of the best investors’ track records by how much more they earned per year than the S&P 500, and by how many consecutive years each record covers:

These are all great, if not legendary, investors. Not only did they beat the market, but 47 of the 50 beat it for 10 years or more, many of them while managing billions of dollars. For example, Fidelity’s Magellan fund grew from ~$20M to $14B during Peter Lynch’s 13 years as its manager.
That matters because the more money you manage, the harder it is to buy enough of a smaller company to make a difference. As Warren Buffett, CEO of Berkshire Hathaway, told BusinessWeek in 1999, “It’s a huge structural advantage not to have a lot of money.” Most individual investors don’t have that problem.
Warren Buffett
At Berkshire Hathaway’s 1996 annual meeting, Buffett said that “diversification is a protection against ignorance.” He explained that if you can’t analyze businesses, owning a little of everything makes sense, but if you can, owning 30, 40 or 50 stocks makes no sense.
In his 1993 letter to shareholders, he wrote that if you truly understand businesses and can find 5-10 sensibly priced companies with lasting competitive advantages, you don’t need to diversify the usual way.
He also invested that way himself. In the mid-1960s, his partnership put ~40% of its money into American Express. From 1957 to 1968, the partnership returned 31.6%/year before his share of the profits, vs. 9.1% for the Dow.
Charlie Munger
Buffett’s longtime partner, Charlie Munger, said in a 1994 talk at USC that “the wise ones bet heavily when the world offers them that opportunity.” Munger’s own partnership, Wheeler, Munger & Co., owned very few stocks, and it returned 19.8%/year from 1962 to 1975, vs. 5% for the Dow.
But being concentrated also meant bigger drops. Munger’s partnership lost ~32% in 1973, and then again in 1974.
Peter Lynch
Peter Lynch owned far more stocks than Buffett and Munger, at least as a fund manager. From 1977 to 1990, he ran Magellan, and $1,000 invested in it grew to $28,000, according to his 1993 book, Beating the Street. That’s ~29%/year, almost double the S&P 500’s ~15% with dividends over the same years (from Robert Shiller’s data).
By 1989, the fund owned ~1,400 stocks, but half of its money was in just 100 stocks.
For individual investors, his advice was very different. In his 1989 book, One Up on Wall Street, he wrote that he’d be comfortable owning between 3 and 10 stocks in a small portfolio. In Beating the Street, he added that a part-time stock picker probably only has time to follow 8-12 companies.
David Gardner
David Gardner, who co-founded The Motley Fool, takes a broader approach. He never puts more than 5% of his portfolio into a new stock, which means a portfolio built his way holds at least 20 stocks. In May 2018, he owned 55.
Then he adds to the stocks that go up, and lets his winners grow into his biggest positions.
That approach relies on a few big winners. By his own count on The Motley Fool’s Rule Breaker Investing podcast in 2018, 21 of his first 200 recommendations for its Stock Advisor service lost half their value or more, but his best one, Netflix (NFLX), rose ~180-fold by October 2018. Those are The Motley Fool’s own, unaudited figures.
So whether they owned 5 stocks or 1,400, a big share of their money ended up in a small number of their best ideas.
For investors who can’t find those ideas, Buffett recommends an index fund. In his 2013 letter, he even wrote that his will tells the trustee to put 90% of the money he leaves his wife in a very low-cost S&P 500 index fund, and the other 10% in short-term government bonds.
How Many Stocks Should You Own Based on Your Skill?
How good you are at choosing stocks, or think you are, changes how many stocks you should own.
To measure how much, I built 5, 10, 15, 25 and 50-stock portfolios for five kinds of stock pickers, using the actual returns of those same 466 stocks from September 2016 to September 2026. The only difference between the stock pickers is which stocks they end up owning.
Related: Is Beating the Market Luck or Skill?
Big Winners and Blowups
Of the 466 stocks, the 47 best, the top 10%, are the big winners. Each one turned $1 into at least $9, and together they produced more than half of all the gains.
At the other end, the bottom 10% are the blowups. Each one turned $1 into $1.22 or less, and 33 of those 47 lost money.
So if you choose a stock at random, there’s a 1 in 10 chance it’s a big winner, and a 1 in 10 chance it’s a blowup.
Adjusting the Returns
The 10 years from September 2016 to September 2026 were better than usual for stocks. The S&P 500 returned 15.2%/year, well above the U.S. stock market’s long-run average of ~10% (10.1%/year from 1926 to 2025, per Bessembinder), and a typical portfolio of 10 randomly chosen stocks returned ~15% as well.
So to keep my comparison realistic, I lowered every stock’s return by the same percentage each month, until that typical random portfolio returned ~10%/year. That doesn’t change which stocks did better than others, or by how much.
Then I compared each portfolio with the market, meaning all 466 stocks in equal amounts. After that adjustment, the market returned ~12%/year, more than a typical random portfolio, since most random portfolios missed the few stocks that drove the market’s gains.
Five Stock Pickers
An average stock picker does no better than choosing at random, so their typical 10-stock portfolio returns ~10%/year. I set the other four by what their typical 10-stock portfolio returns, and those returns decide how often each one chooses a big winner or a blowup:
For reference, even if you’d owned the decade’s 10 best stocks, you would’ve earned ~42%/year after the adjustment. The legendary stock picker’s ~25% is ~15%/year more than an average stock picker, about what Lynch and Munger beat the market by.
Without an Edge
First, I gave every stock picker the same odds on every stock they buy, whether they own 5 stocks or 50. For the terrible, bad and average stock pickers, owning more stocks barely raised the share of portfolios that beat the market:
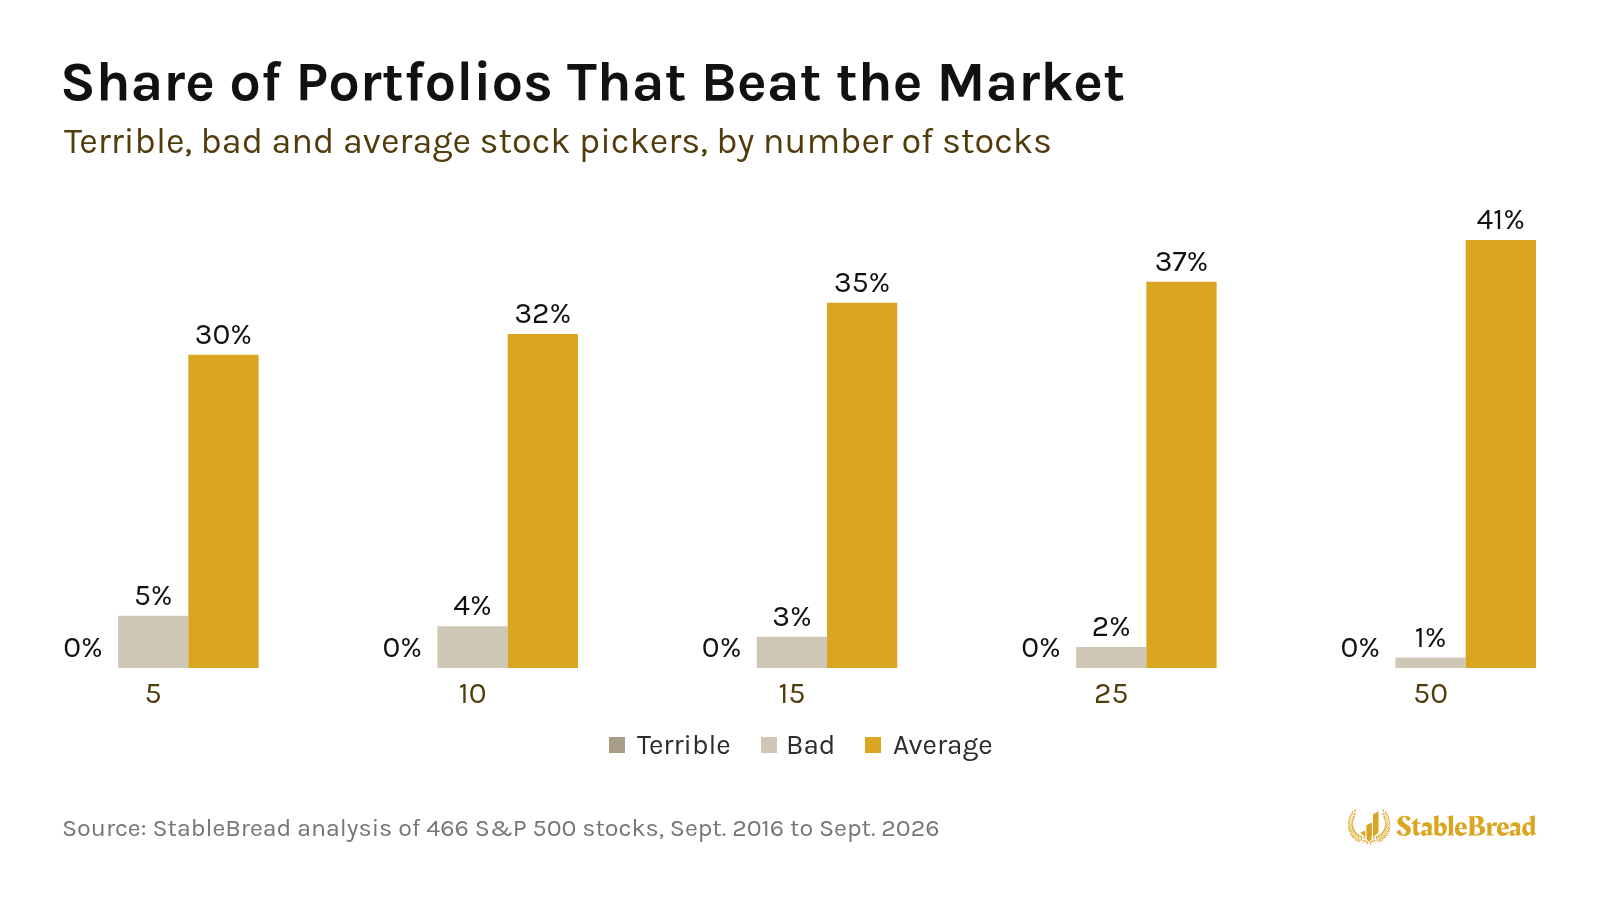
The average stock picker’s odds of beating the market went from 30% with 5 stocks to 41% with 50. The bad stock picker’s odds were 5% or less, and the terrible stock picker almost never beat the market, no matter how many stocks they owned.
What owning more stocks did change was how bad the worst cases were. With 5 stocks, 15% of the average stock picker’s portfolios ended up with less than half as much money as they would’ve had in the market:
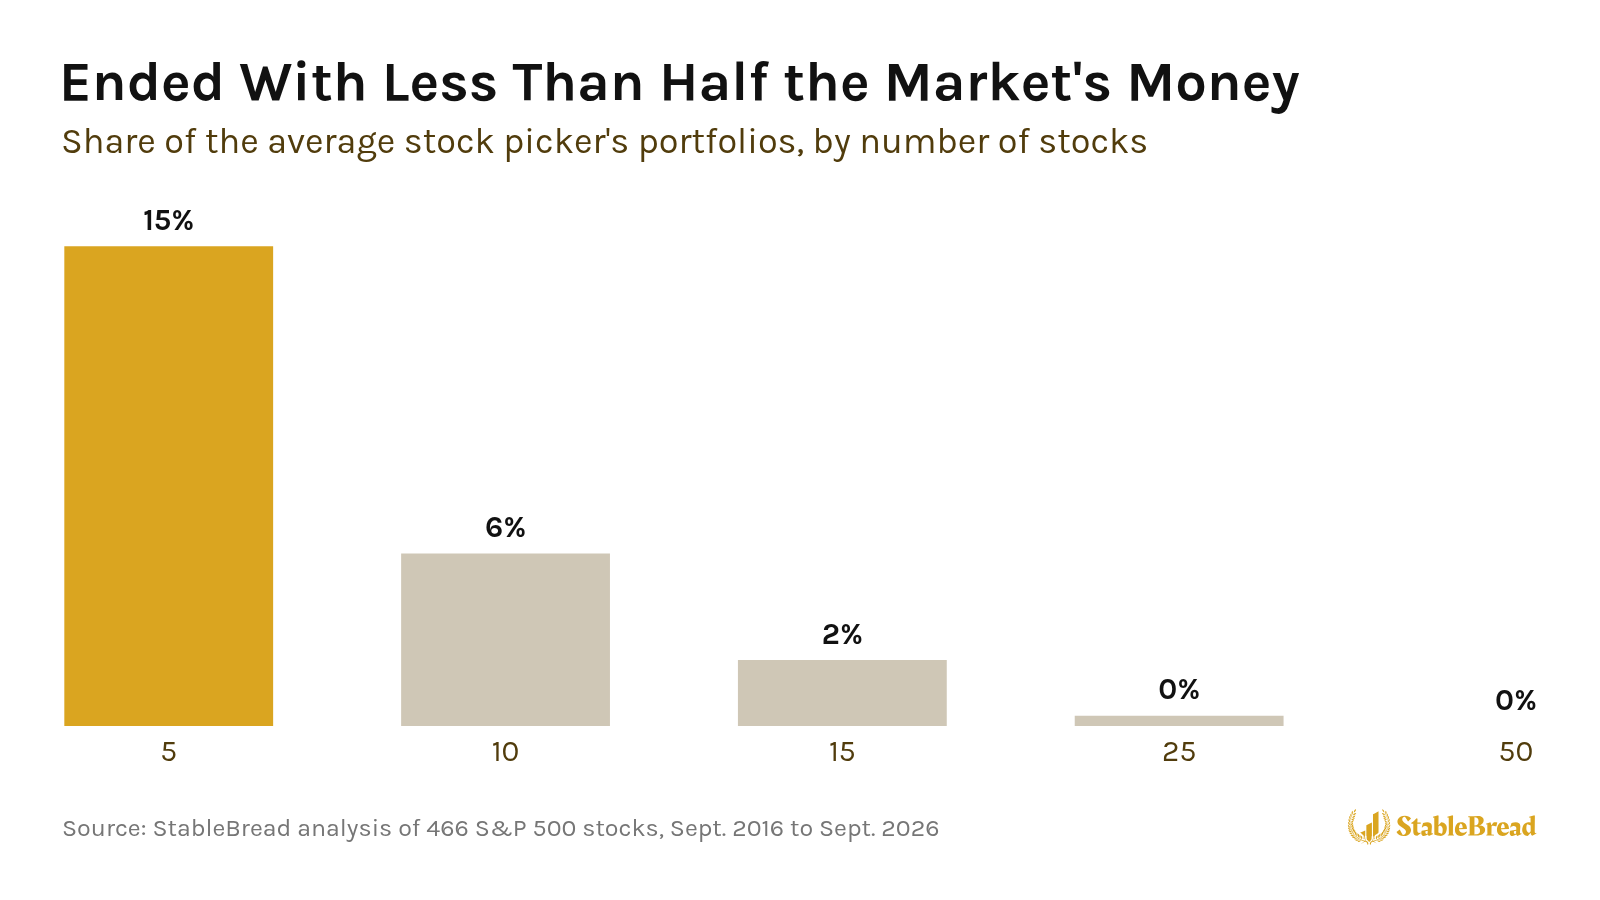
With 15 stocks, only 2% did. So if you don’t have an edge, owning fewer stocks only raises your odds of a disaster, which is why an index fund makes more sense.
With an Edge
For the good and legendary stock pickers, more stocks kept raising their odds of beating the market:
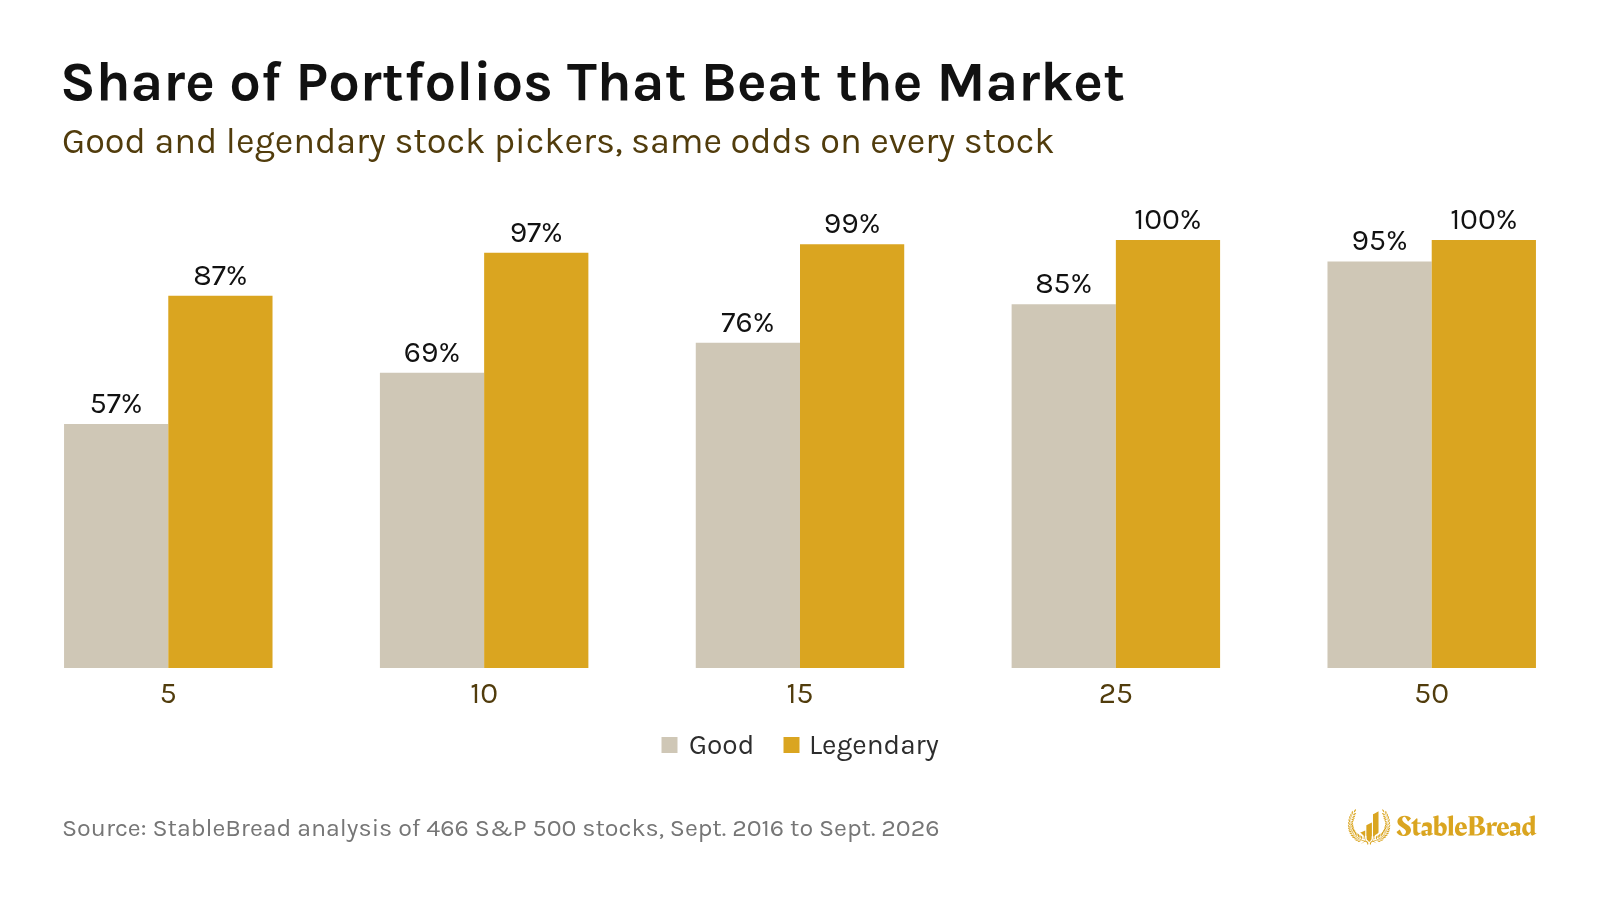
The good stock picker’s odds went from 57% with 5 stocks to 95% with 50, and the legendary stock picker’s from 87% to nearly 100%.
However, those results assume the good and legendary stock pickers keep their odds on every stock they buy. My comparison holds every stock for the full 10 years, but in reality, some stocks make most of their gains in a year or two, and others take the whole decade. So what limits a good stock picker isn’t how many big winners there are, but how many companies they can follow closely at once.
Limited to the Best Ideas
Lynch thought a part-time stock picker could only follow 8-12 companies. So I also ran the comparison with the good and legendary stock pickers’ odds on just their 10 best ideas, and every stock after that chosen at random. With that limit, the good stock picker’s odds of beating the market peaked at 10 stocks:
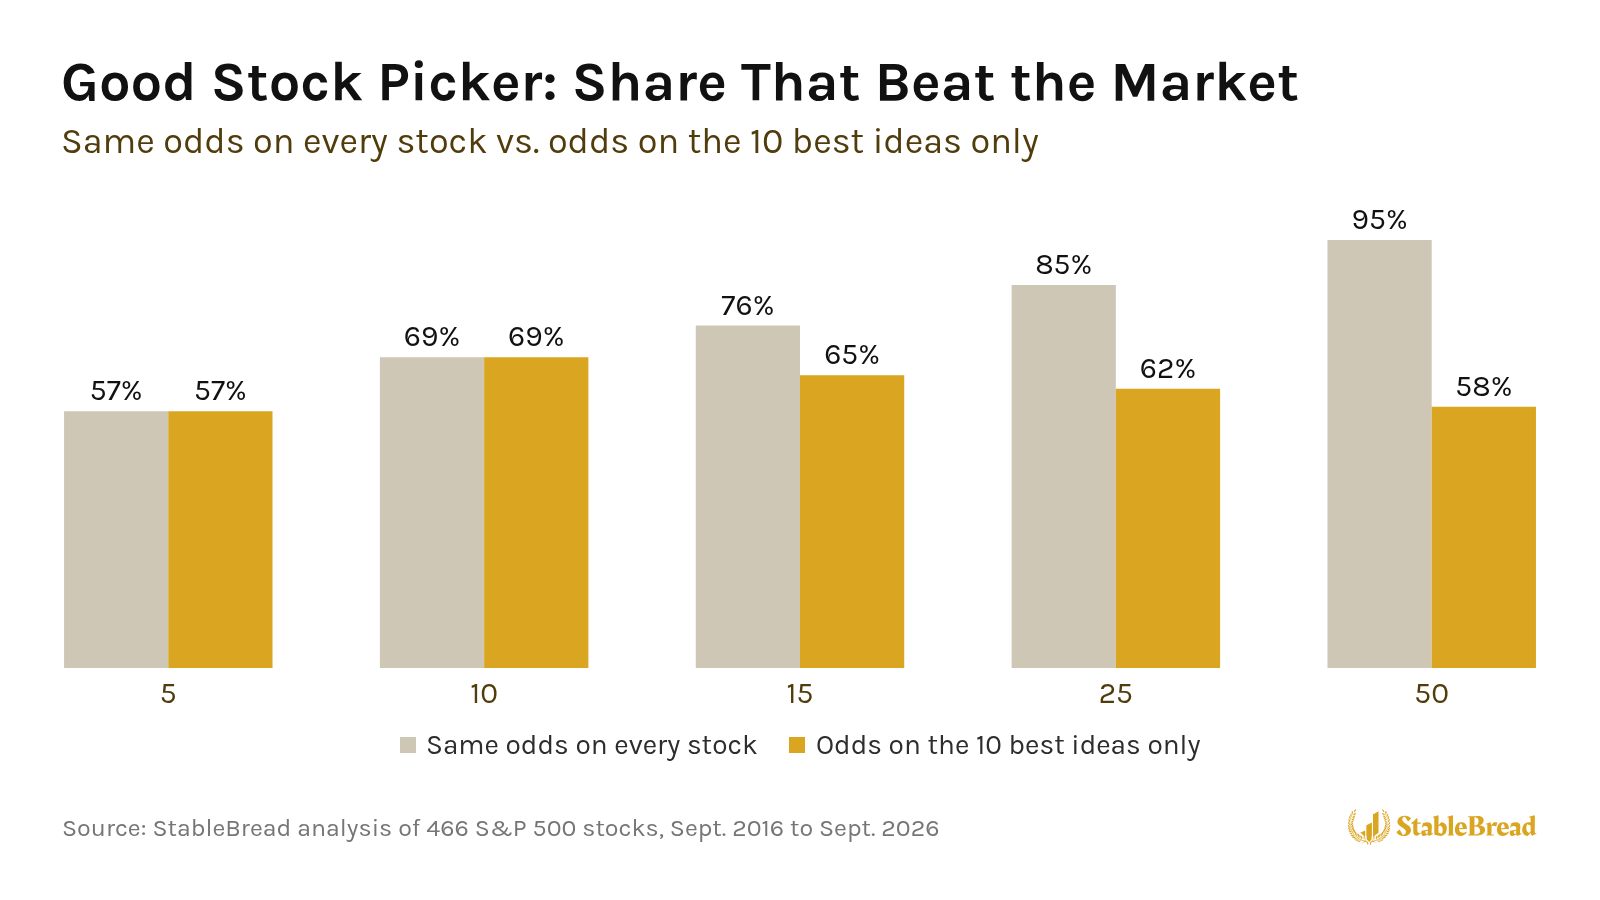
With 10 stocks, 69% of their portfolios beat the market, vs. 57% with 5 stocks and 58% with 50. Those 10-stock portfolios owned ~2 big winners on average, and only 12% of them had none. After their 10 best ideas, every extra stock diluted their edge.
The legendary stock picker’s odds also peaked at 10 stocks, at 97%, vs. 87% with 5 stocks and 86% with 50.
In both cases, just a couple of stocks did most of the work. In their 10-stock portfolios, the two best holdings made ~66% of the good stock picker’s gains, and ~71% of the legendary stock picker’s.
Note: The comparison only includes stocks still in the S&P 500 as of October 2026, so it excludes companies that were dropped from the index or went bankrupt. That makes concentrated portfolios look safer here than they really are.
Volatility and Risk-Adjusted Returns
I also measured each portfolio the way a portfolio manager would, starting with volatility, which is the standard deviation of a portfolio’s returns. For every kind of stock picker, owning more stocks lowered the volatility.
For the average, good and legendary stock pickers, a typical 5-stock portfolio had 21-27% volatility per year, and its biggest drop from a peak was 33-37%. With 15 stocks, that fell to 19-24% volatility, and a biggest drop of 29-34%. The market had 17% volatility, and its biggest drop was 27%.
The unluckiest 1 in 10 portfolios did much worse. Their biggest drop was 48-53% with 5 stocks, vs. 39-43% with 15.
Sharpe Ratio
Portfolio managers also track the Sharpe ratio, which divides a portfolio’s return above Treasury bills by its standard deviation, so it measures how much return you earned relative to how much your portfolio swung:
Sharpe Ratio = (rp - rf) / σp
where:
- rp = portfolio’s return
- rf = risk-free rate (the Treasury bill rate)
- σp = standard deviation of the portfolio’s returns
After the adjustment, the market’s Sharpe ratio was 0.62 over those 10 years. The average stock picker’s never caught up, going from 0.42 with 5 stocks to 0.57 with 50. The good stock picker’s came in close to the market’s, between 0.56 and 0.65, even though 69% of their 10-stock portfolios beat the market.
Here’s how each stock picker’s typical 10-stock portfolio compared with the market:
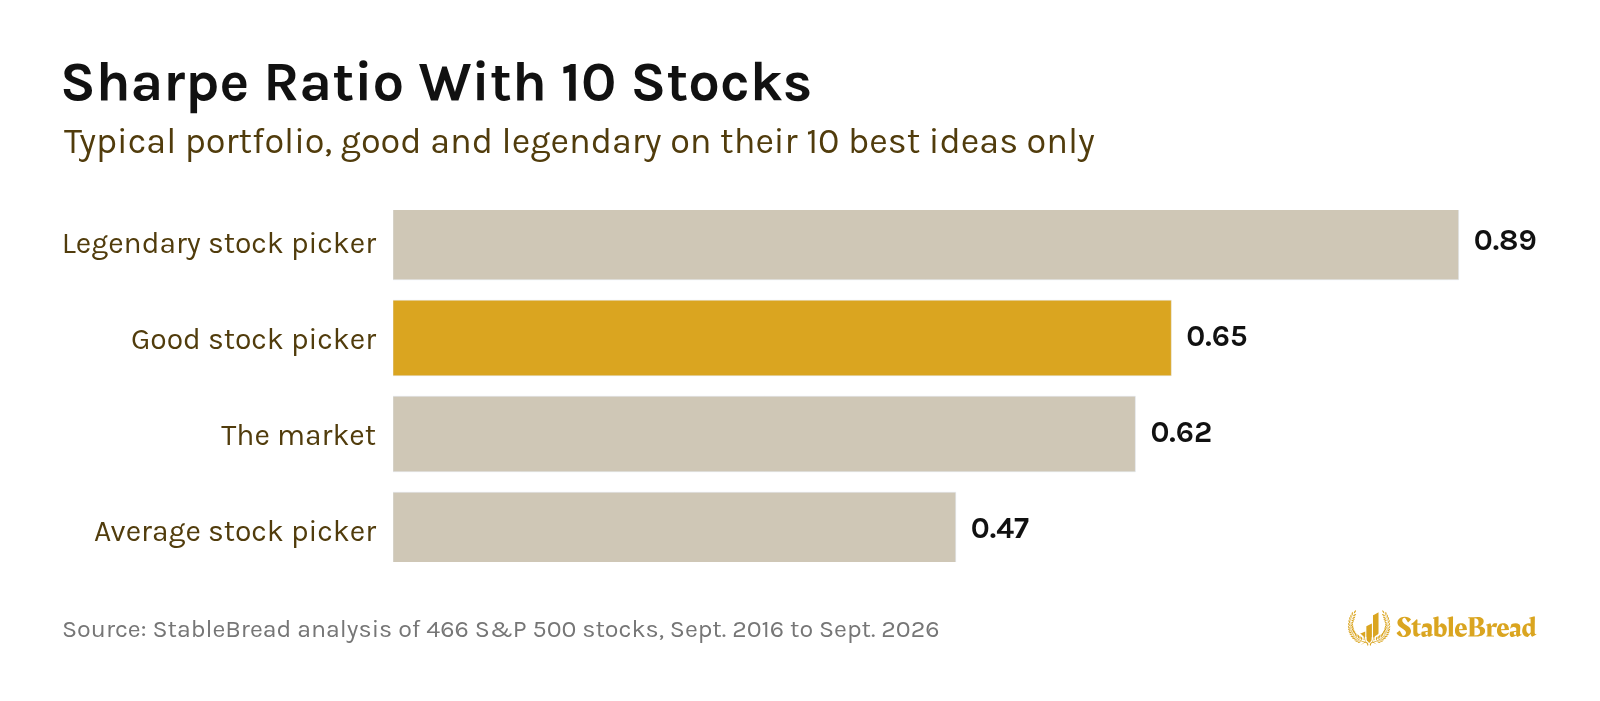
Only the legendary stock picker’s Sharpe ratio was clearly higher than the market’s, peaking at 0.89 with 10 stocks.
Sortino Ratio
The Sharpe ratio counts big upswings against you, just like the drops. Owning fewer stocks, and more of the big winners, makes a portfolio swing more, so the good stock picker’s Sharpe ratio wasn’t clearly higher than the market’s. With 10 stocks, their portfolio had 21.2% volatility per year, vs. 17.1% for the market.
The Sortino ratio fixes that by only counting the swings below the Treasury bill rate:
Sortino Ratio = (Rp - rf) / σd
where:
- Rp = portfolio’s return
- rf = risk-free rate (the Treasury bill rate)
- σd = downside deviation, which only counts the returns below rf
By that measure, the good stock picker’s 1.06 was above the market’s 0.94, and the legendary stock picker’s 1.58 was well above both:
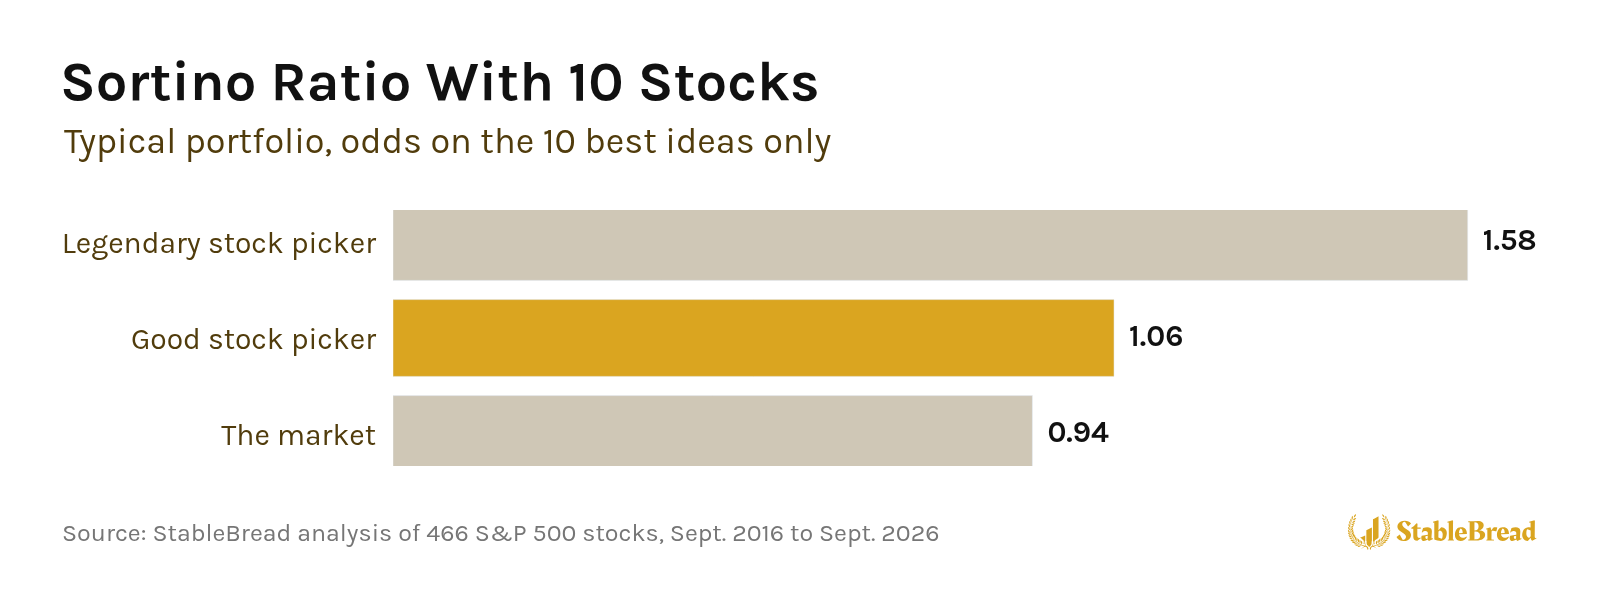
So owning fewer stocks widened the range of outcomes for every kind of stock picker, and only a large edge clearly paid off once you account for volatility.
Related: How to Measure Your Portfolio’s Risk-Adjusted Performance
Morningstar’s Study
In a January 2026 study, Morningstar compared more than 5,800 funds based in Europe by how concentrated they were. From September 2015 to September 2025, the most concentrated third of those funds trailed the least concentrated third by 1%/year, and the concentrated funds charged 0.31% more per year in fees.
Morningstar concluded that concentration wasn’t good or bad in itself, but that it widened the range of outcomes.
My comparison put the same amount into every stock. More realistically, if you concentrate, you’re not going to split your money evenly, and your winners and losers will quickly change how much of your portfolio each stock makes up. So you also need to decide how much to put in each stock.
How Much to Invest in Each Stock
In a concentrated portfolio, how much you invest in each stock decides how much any one winner or loser can move your returns.
Kelly Criterion
One way to size each position is the Kelly criterion. In 1956, John Kelly, a physicist at Bell Labs, worked out how much a gambler with an edge should bet to grow their money as fast as possible over many bets.
In short, the bigger your edge, the more you bet:
f = (b × p - q) / b
where:
- f = share of your money to bet
- b = what you win for every $1 you bet (the net odds)
- p = chance of winning
- q = chance of losing (1 - p)
Example: A bet that pays $1 for every $1 you bet, with a 60% chance of winning, would get 20% of your money ((1 × 0.6 - 0.4) / 1). At a 55% chance, the amount halves, to 10%.
The problem is that the formula assumes you know your edge exactly. Ed Thorp, a math professor who used the Kelly criterion in blackjack and later in his hedge fund, proved that if you think your edge is twice as big as it really is, betting the full Kelly amount leaves your money growing no faster than Treasury bills.
That’s why Thorp suggests betting half the Kelly amount or less. Half Kelly keeps about three-quarters of the growth, with half the swings.
Mohnish Pabrai’s Bet
Fund manager Mohnish Pabrai describes a real example of betting less than Kelly in his 2007 book, The Dhandho Investor. In 2000, he bought Stewart Enterprises, a funeral home company, after estimating an 80% chance the stock would at least double within two years, a 19% chance he’d break even, and a 1% chance he’d lose everything.
On those odds, the Kelly criterion says to allocate 97.5% of the fund into that one stock, but Pabrai only invested 10%:
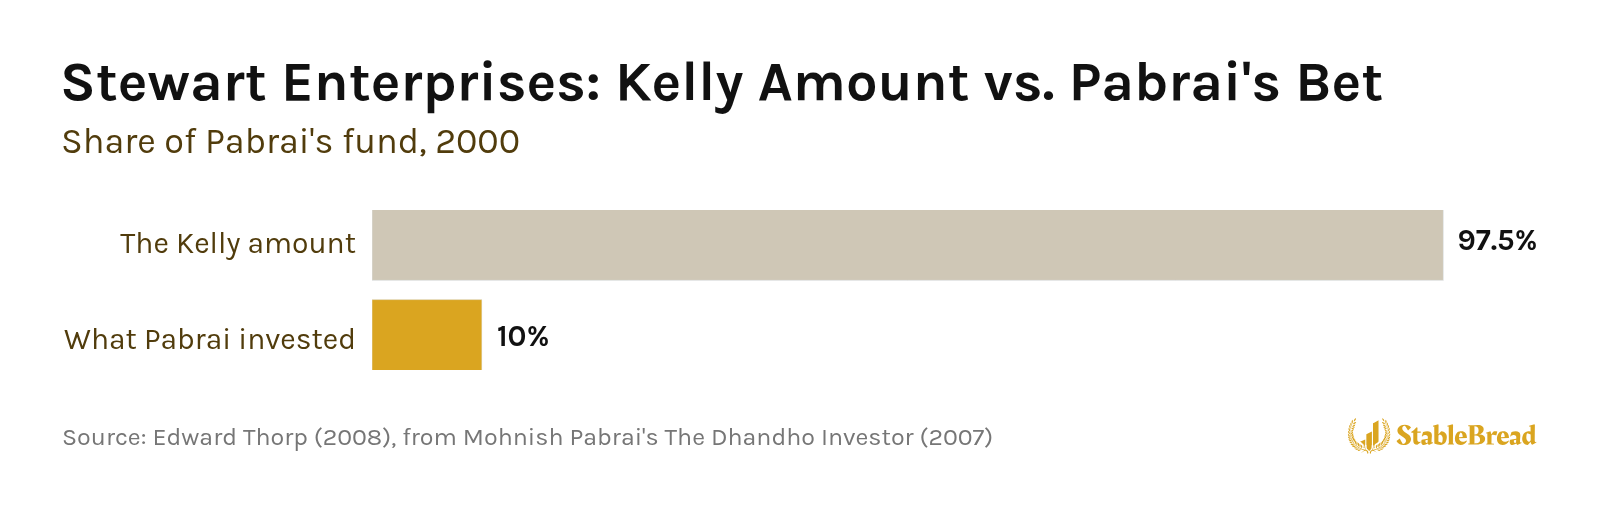
That left him plenty of room to be wrong. If the 1% case had happened, a 97.5% bet would’ve wiped out almost the entire fund, while his 10% bet would’ve cost the fund 10%.
Thorp’s Version for Stocks
Kelly’s formula assumes a bet with a few set outcomes, like Pabrai’s three, but a stock’s return can land anywhere in a range.
For that case, Thorp worked out a version that divides a stock’s expected return above Treasury bills by its volatility, and then by its volatility again:
f = (m - rf) / σ2
where:
- f = share of your money to put in the stock
- m = stock’s expected return
- rf = risk-free rate (the Treasury bill rate)
- σ = stock’s volatility (standard deviation)
Example: A stock you expect to beat Treasury bills by 6%/year, with 40% volatility, would get 37.5% of your money (0.06 / 0.402). If that edge is really only 3%, the amount halves, to ~19%.
Risk-Constrained Kelly
In 2016, Stanford researchers Enzo Busseti, Ernest Ryu and Stephen Boyd also published a risk-constrained version of the Kelly criterion.
Instead of betting a set fraction of the Kelly amount, you choose the biggest drop you’re willing to risk, like no more than a 10% chance of ever losing 30% of your money, and their method finds the bets that grow your money fastest within that limit:
Maximize E[log(W)], subject to E[W-λ] ≤ 1
where:
- W = what each $1 becomes after one round of bets, depending on how you split your money across the bets
- E[ ] = the average across every possible outcome
- λ = log(β) / log(α)
- α = lowest your money can fall to, as a share of what you started with (0.7 for a 30% loss)
- β = highest chance you’ll accept of ever falling that low (0.1 for 10%)
Example: For no more than a 10% chance of ever losing 30% of your money, λ = log(0.1) / log(0.7), or ~6.46. Without the second condition, the same problem gives the full Kelly bet.
In one of their examples, full Kelly had a ~40% chance of losing 30% at some point. Their version cut that chance to under 10%, kept about three-quarters of Kelly’s growth, and grew about one-third faster than fractional Kelly at the same risk.
So whichever version you use, the Kelly amount is best used as a ceiling, not a target.
Letting Winners Grow
Once you’ve bought a stock, it’s also worth letting your winners grow, since a handful of them will likely carry your portfolio. In his 1988 letter, Buffett compared selling winners while holding on to losers to what Peter Lynch called “cutting the flowers and watering the weeds.”
In a concentrated portfolio, I’d also avoid three kinds of companies most likely to cause a permanent loss:
- Heavy borrowers: Banks and other businesses that borrow heavily.
- Very cyclical businesses: Companies whose earnings rise and fall with the economy.
- Capital-dependent businesses: Companies that need to keep raising money to grow.
In a 10-stock portfolio split evenly, one of those going to zero costs you 10% of your money, and the other nine would then need to rise ~11% just to get you back to even.
How Many Stocks I’d Own
Based on the evidence, most investors should own 10-15 stocks, made up of their best ideas. That’s enough to reduce the unsystematic risk by 86-90%, and few enough that each winner makes a real difference.
That’s also close to the 8-12 companies Lynch thought a part-time investor could follow. And in my comparison, once their edge was limited to their 10 best ideas, a good stock picker’s odds of beating the market rose from 57% with 5 stocks to 69% with 10.
If you’re exceptional, 5-10 stocks can be enough, which is what Buffett suggested for investors who truly understand businesses.
However, if you’re not sure your stocks will actually beat the market, I’d own a low-cost index fund instead. In my comparison, the average stock picker’s typical portfolio trailed the market with any number of stocks, and owning fewer only raised the odds of a disaster.
Even the good stock picker’s Sharpe ratio came in close to the market’s. So unless your edge is real and large, an index fund gives you about as much return for the volatility you take.
So the right number of stocks depends less on a formula than on how good you are at choosing stocks. Beyond choosing stocks, holding them and knowing when to sell matter as well, which is a separate topic altogether.
