

In 2005, Nick Sleep and Qais Zakaria of Nomad Investment Partnership introduced a concept in their interim letter that changed how many investors think about competitive advantages.
Sleep and Zakaria called it the “robustness ratio,” a simple calculation that measures the true strength of a company’s economic moat.
Sleep’s main example was Costco (COST). He estimated that the average Costco cardholder saved $150/year by shopping at Costco instead of at Walmart or supermarket chains like Kroger, while Costco earned only $32 per cardholder for its shareholders, before taxes. In other words, Costco’s customers saved ~$5 for every $1 its shareholders earned.
The higher the ratio, the more of its own profits a competitor would need to give up to offer customers the same savings. Costco also turned out to be a great investment, as its stock rose 22-fold from the end of 2005 to November 13, 2026, vs. only 6-fold for the S&P 500.
So if you invest in companies that compete on price, the robustness ratio can help you judge how hard their moats are to cross, and notice when management begins trading that moat away for short-term profits.
Below, I’ll explain how the robustness ratio works with the examples of GEICO, Costco, and Netflix, why a high ratio protects a company from its competitors but can also hold its stock back, and why valuation still matters regardless of how attractive the ratio may be.
Robustness Ratio
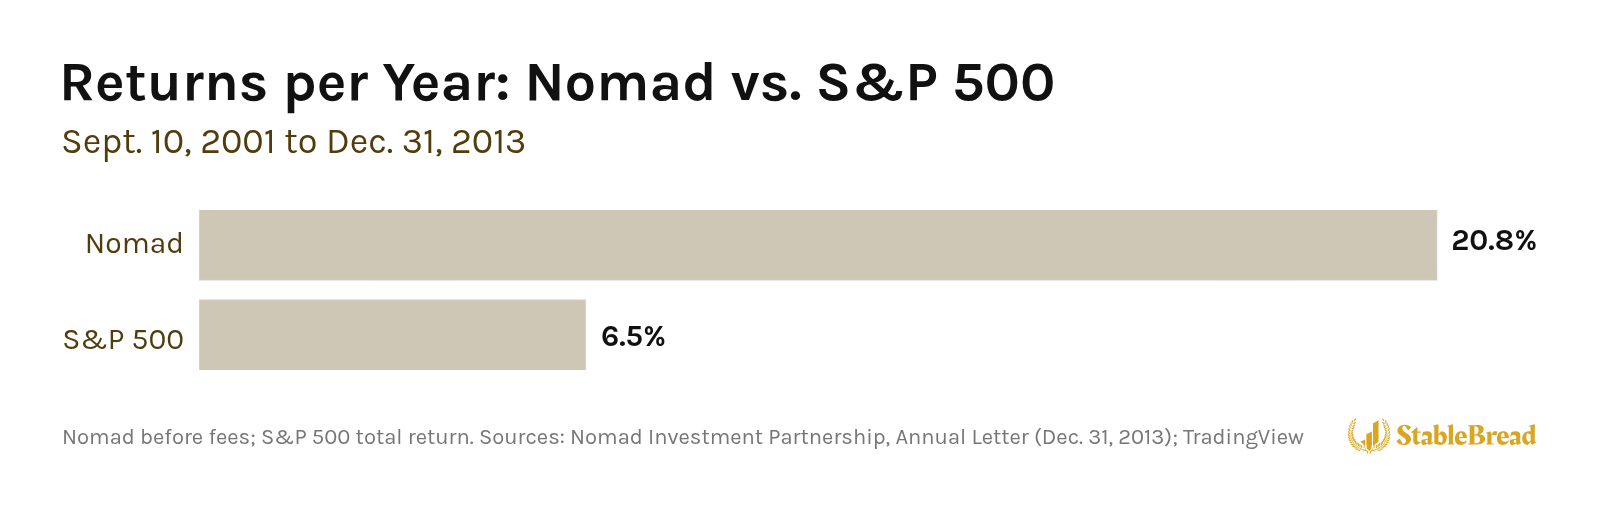
Nick Sleep ran the Nomad Investment Partnership with Zakaria from 2001 until they closed it in 2014. From September 10, 2001 to December 31, 2013, Nomad returned 20.8%/year before fees, while the S&P 500’s total return was 6.5%/year:
The robustness ratio measures how much money customers save compared to how much shareholders earn. In Nomad’s interim letter for the period ended June 30, 2005, Sleep defined it as “the amount of money a customer saves compared to the amount earned by shareholders,” which works out to:
Robustness Ratio = Customer Savings / Shareholder Profits
A ratio of 1:1 means customers save one dollar for every dollar shareholders earn. A ratio of 5:1 means customers save five dollars for every dollar of profit. Sleep saw the ratio as a way to think about how wide a company’s moat is.
Related: How to Use the VRIN Framework to Identify Sustainable Moats
The calculation works best for businesses where the customer proposition centers on price, like warehouse retailers or insurers that sell directly to their customers. The ratio is less useful for companies that sell on their brand, like Louis Vuitton, whose customers pay more for the name, not to save money.
Note: Sleep also wrote that the ratio isn’t a precise formula, and that a falling ratio doesn’t necessarily mean a company’s moat is shrinking.
Sleep’s first example came from Warren Buffett, whose company, Berkshire Hathaway, owns the car insurer GEICO. In his 2004 letter to shareholders, Buffett wrote that GEICO’s customers saved ~$1B compared to what they would otherwise have paid for their insurance that year, while GEICO earned close to $1B of underwriting profit.
That 1:1 split between customer savings and shareholder profits caught Sleep’s attention and prompted him to examine whether other businesses displayed similar patterns of value distribution.
GEICO Example
To understand how the robustness ratio works, look at GEICO’s economics in 2004:
- Customer savings: $1B (compared to what customers would otherwise have paid for their insurance)
- Underwriting profit: ~$1B pre-tax (what GEICO made from selling insurance after paying its customers’ claims and its own expenses)
- Float value: $250-300M (Sleep’s assumed 5% return on $5-6B of float, the premiums customers pay up front that GEICO holds until it pays their claims)
- Profit-sharing to employees: $191M (employees received bonuses averaging 24.3% of their salaries)
In total, GEICO’s customers got $1B, its shareholders got $1.25B (the underwriting profit plus $250M from the float, the low end of Sleep’s range), and its employees got $191M. Here’s Sleep’s pie chart of that division, which I’ve recreated:

Sleep called GEICO’s split a “fair division of the spoils,” and it gave GEICO a robustness ratio of ~1:1, a fair balance between creating customer value and generating profits.
Costco Example
Costco presented a significantly different picture than GEICO. Here’s Sleep’s analysis of the average Costco cardholder, from his 2005 letter:
- Annual spending per cardholder: $1,100
- Costco’s cost to supply these goods: $980 (gross margin: $120/$1,100 = 11%)
- What the same items would cost at Kroger: $1,300 (gross margin: $320/$1,300 = 26%)
- What the same items would cost at Walmart: $1,250 (gross margin: $270/$1,250 = 23%)
In other words, a shopper buying $980 worth of goods at wholesale would pay $1,100 at Costco, $1,250 at Walmart, or $1,300 at Kroger. The difference comes from each retailer’s markup.
After accounting for the $23 annual membership fee, Sleep estimated each Costco cardholder saved ~$150/year compared to shopping elsewhere ($175 estimated gross savings minus $23 membership fee).
Based on meetings with Costco’s management, Sleep put Costco’s pay and benefits 55% above its competitors’. Assuming 70% of Costco’s SG&A (selling, general, and administrative expenses) went to its employees, Sleep calculated that Costco “overpaid” its workforce by $1.1B per year compared to its competitors, or $26 per cardholder.
Shareholders received the smallest slice. At $32 per cardholder pre-tax (Costco’s pre-tax profits divided by cardholder count), they earned just 15% of the total value created. Costco’s robustness ratio came to ~5:1, meaning customers saved five dollars for every dollar earned by shareholders.
Here’s Costco’s division of benefits per cardholder, in the same form as GEICO’s:

Sleep wrote that Wall Street would see a split like Costco’s as giving away money that should have gone to its shareholders, while he saw a moat too wide for competitors to cross.
The gap between value creation and value extraction, relative to competitors, was substantial. You could consider it the untapped pricing power over customers that Costco chose not to exercise.
Related: Two Types of Pricing Power and Why Latent Pricing Power Matters Most
Why High Ratios Create Unassailable Moats
High robustness ratios create nearly insurmountable competitive barriers. For instance, Sleep calculated what it would cost Sam’s Club, Walmart’s warehouse club, to match Costco’s value proposition:
- Matching prices: Would cost $1.4B annually
- Matching wages: Would cost $750M annually
- Total cost: $2.15B
The $2.15B is nearly a quarter of the $9B Walmart (WMT) had earned the year before, and as Sleep put it, even Walmart couldn’t ignore costs that large. The competitive gap becomes self-reinforcing, as Costco’s scale advantages and increasing buying power allow it to widen the moat over time.
Get Our 50-Question Stock Analysis Checklist!
After researching hundreds of stocks, we built this 50-question checklist to guide your analysis and help you avoid costly mistakes.
Download ChecklistSleep observed that Costco’s model creates a virtuous cycle. Lower prices drive volume growth, which increases buying power, allowing even lower prices. The company’s culture ensures these benefits flow primarily to customers rather than shareholders, making the model nearly impossible to attack.
Danger of Corporate Culture Shifts
High robustness ratios create their own risks. When companies consistently favor customers over shareholders, stock prices can stall.
Costco’s net sales nearly doubled from fiscal 1999 to fiscal 2005, but its stock ended 2005 only 8% higher than at the end of 1999. Sleep called it a “share-price famine.”
The famine worried Sleep because a cheap stock can attract private equity firms, which could buy the entire company mostly with borrowed money in a leveraged buyout. Costco’s long-term shareholders would then be forced to sell at a low price, which Sleep compared to theft.
Sleep also observed that Costco’s management had begun “gently tinkering” with the division of benefits, shifting a little more toward shareholders (e.g., slightly raising prices or slowing wage increases). Management did so partly to please investors focused on quarterly earnings, and partly because a buyout was a real threat at the time.
When current management tweaks the robustness ratio to boost the stock price, it signals to future leaders that such changes are acceptable. Each new management team pushes a little further, gradually transforming a customer-first culture into a typical profit-maximizing business. Sleep argued that the split should only change for competitive reasons, not to please investors.
Sleep believed there was a better solution. Instead of compromising the business model, Costco should use its balance sheet to buy back its own shares while they were cheap, and let the growth in its free cash flow per share lift the stock price. Buybacks would reward patient shareholders who understand the model while maintaining the high robustness ratio that makes the business nearly impossible to compete against.
Costco Since 2005
Costco’s management has kept passing most of the benefits on to its customers for more than 20 years since Sleep’s letter. In fiscal 2026 (ended August 30, 2026), Costco’s gross margin was 11.1%, about the same as the 11% in Sleep’s numbers, and 92.3% of its members in the U.S. and Canada renewed, per its 10-K for fiscal 2026.
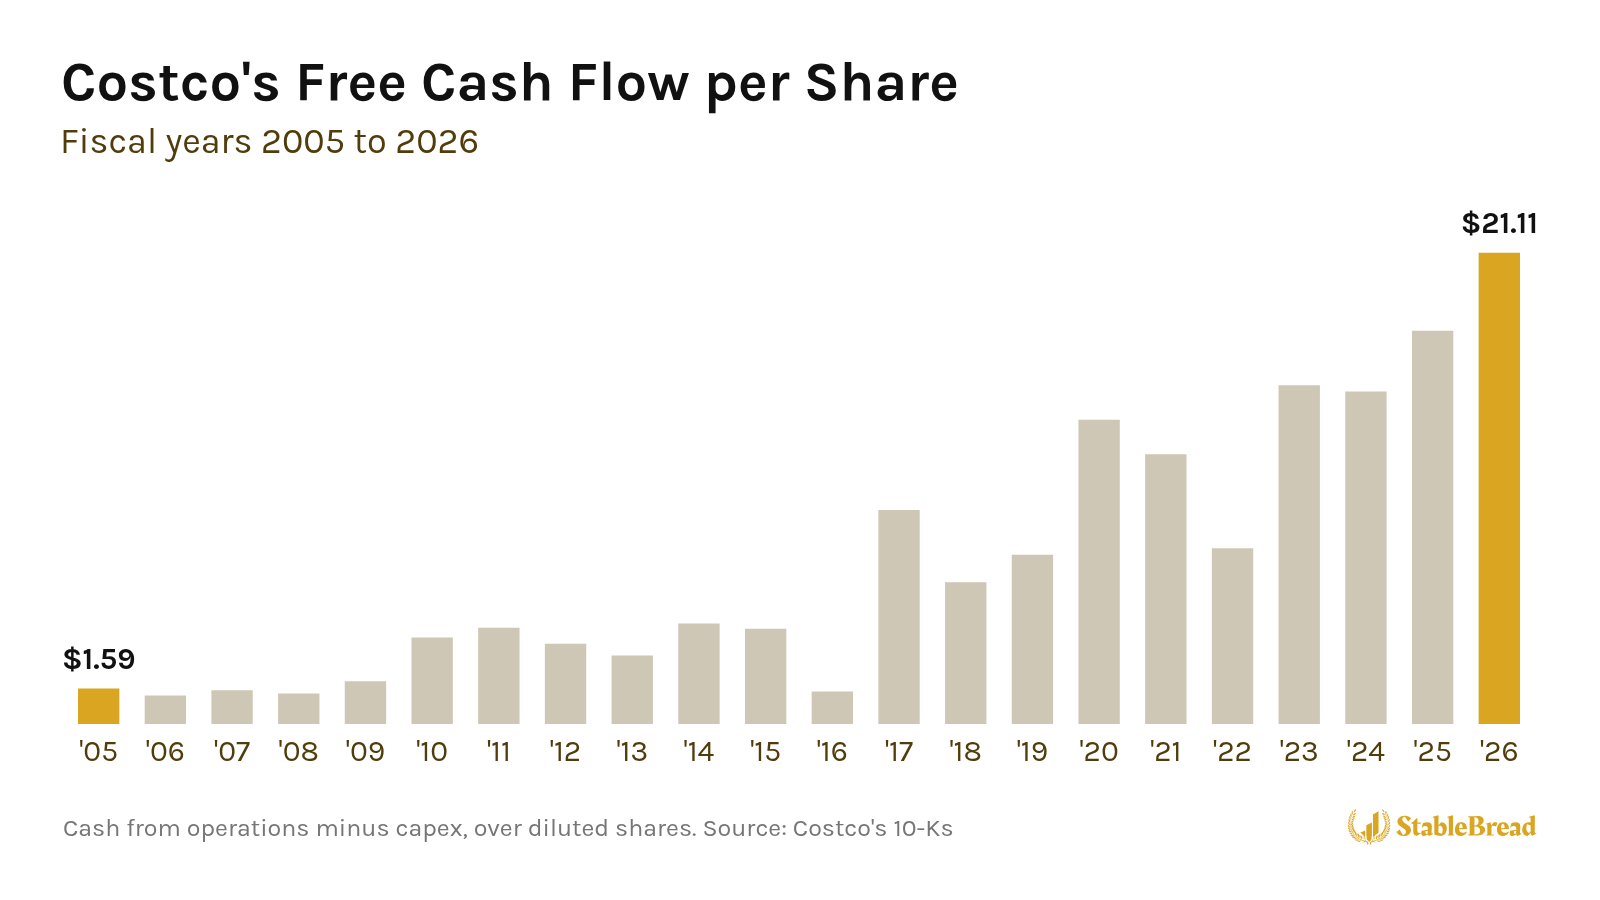
Even with prices that low, Costco’s free cash flow per share grew more than 13-fold, from $1.59 in fiscal 2005 to $21.11 in fiscal 2026:
Costco’s share price rose even faster than its free cash flow per share. Here’s Costco’s share price against the S&P 500’s from the end of 2005, dividends excluded:
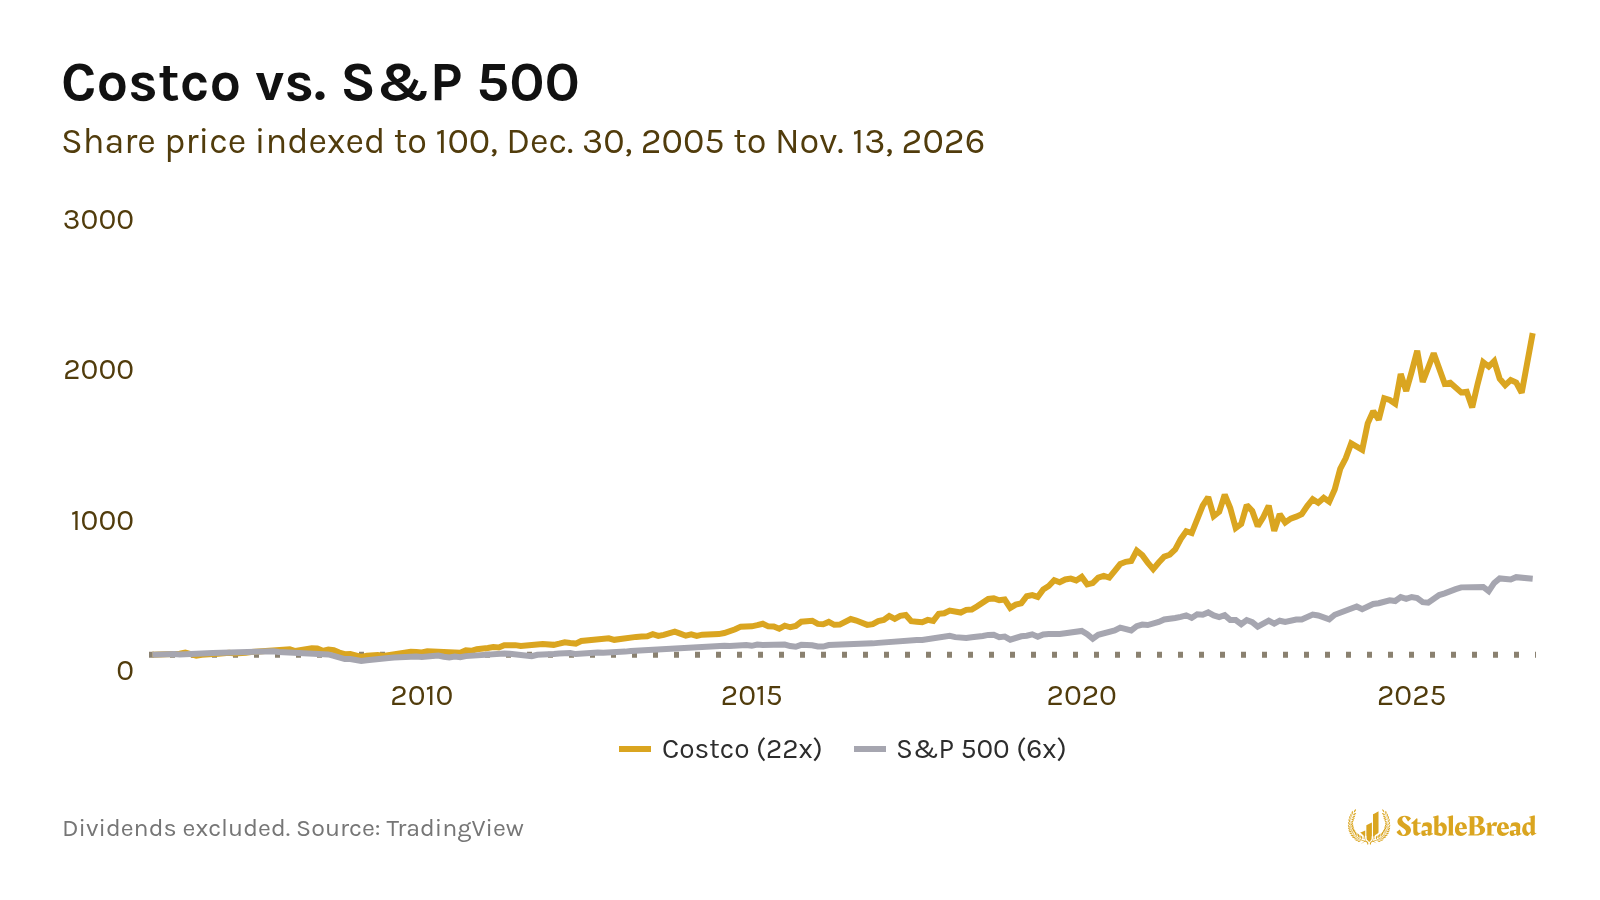
So the high ratio that held Costco’s stock back from 1999 to 2005 paid off for its customers and its shareholders over the two decades that followed.
Netflix Example
Costco is an example of a company that chose to keep its robustness ratio high. Netflix (NFLX), on the other hand, lowered its ratio on purpose, and its profits grew as a result.
In February 2025, Marathon Asset Management, a London investment firm, revisited Sleep’s ratio in “Robustness Ratio Revisited,” an episode of The Capital Cycle Podcast, and Netflix was one of the examples it discussed.
In early 2022, Netflix had ~222M paid memberships, and it estimated that its service was being shared with more than 100M other households that weren’t paying. Those households watched Netflix for free, which pushed its robustness ratio up.
In early 2023, Netflix started charging for password sharing, first in a few countries like Spain, then in more than 100 countries in May, including the U.S. Since Netflix had already paid for its shows, the revenue from those new payments came with a high incremental margin, meaning most of each additional dollar turned into profit.
From 2022 to 2024, Netflix’s revenue grew 23%, while its net income nearly doubled from $4.5B to $8.7B.
So Netflix reclaimed profits it had been giving away for free, and although some people canceled instead of paying, its paid memberships kept growing:
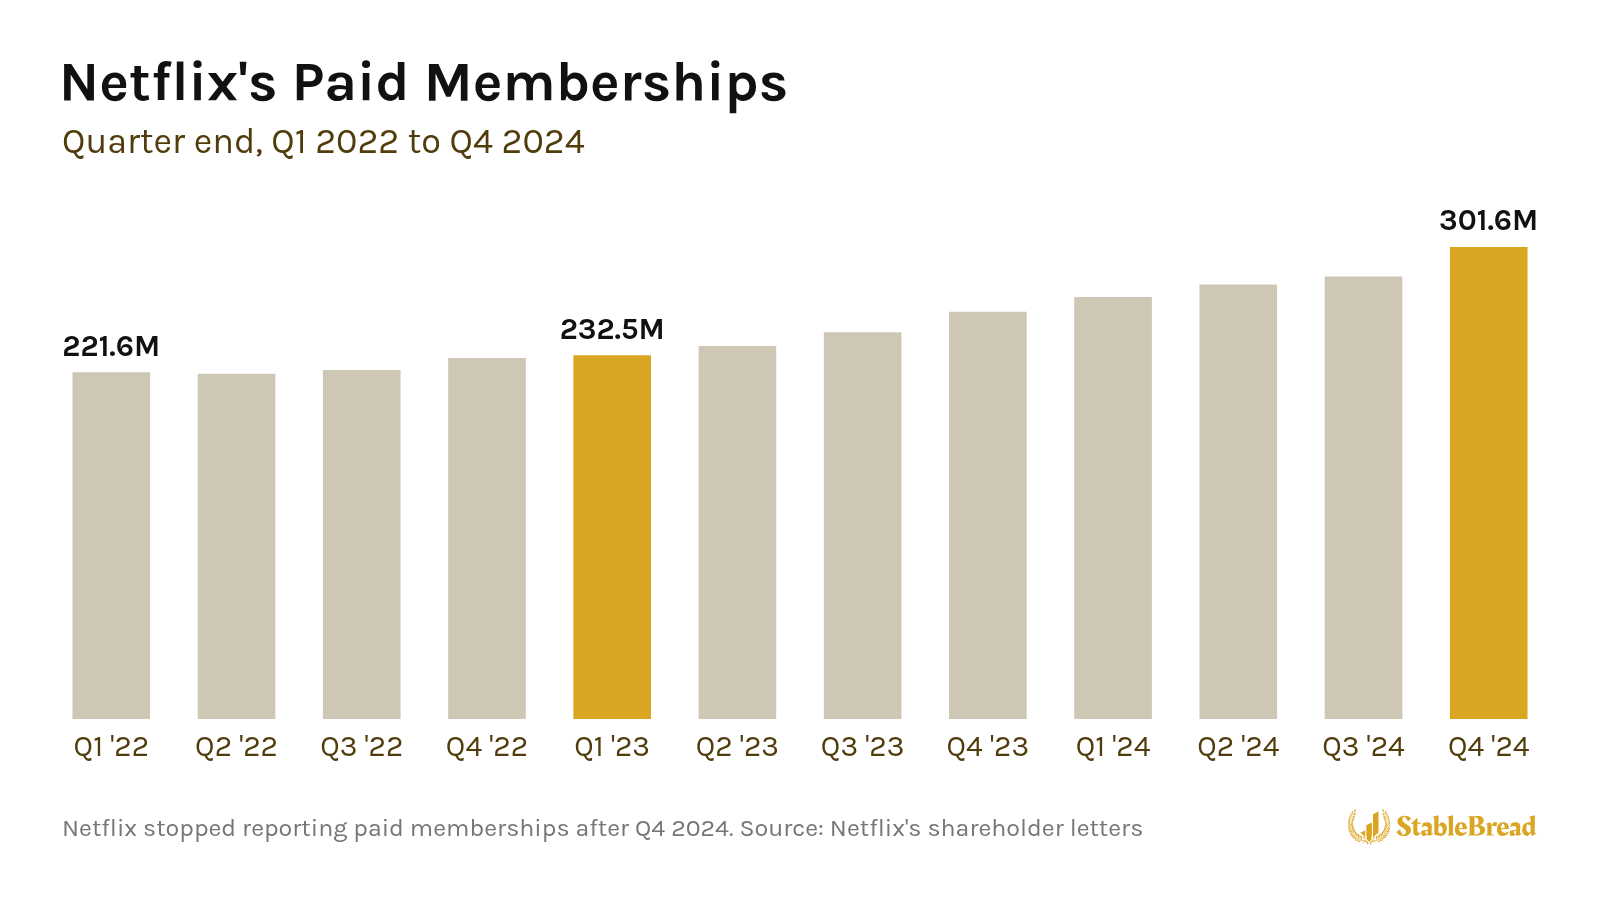
Worldwide, Netflix’s paid memberships grew by 69M from the end of March 2023 to the end of 2024, to ~302M, a sign its members still saw Netflix as good value for the money.
Note: Beyond robustness ratios, Marathon looks for consistent market share expansion, which signals customers recognize superior value, and healthy ecosystem economics across the entire value chain. Strong companies ensure everyone in their ecosystem thrives.
Importance of Valuation
The robustness ratio can help you find great businesses, but it doesn’t tell you what price to pay for their stocks. Marathon’s podcast gave several cautionary examples from the late 1990s.
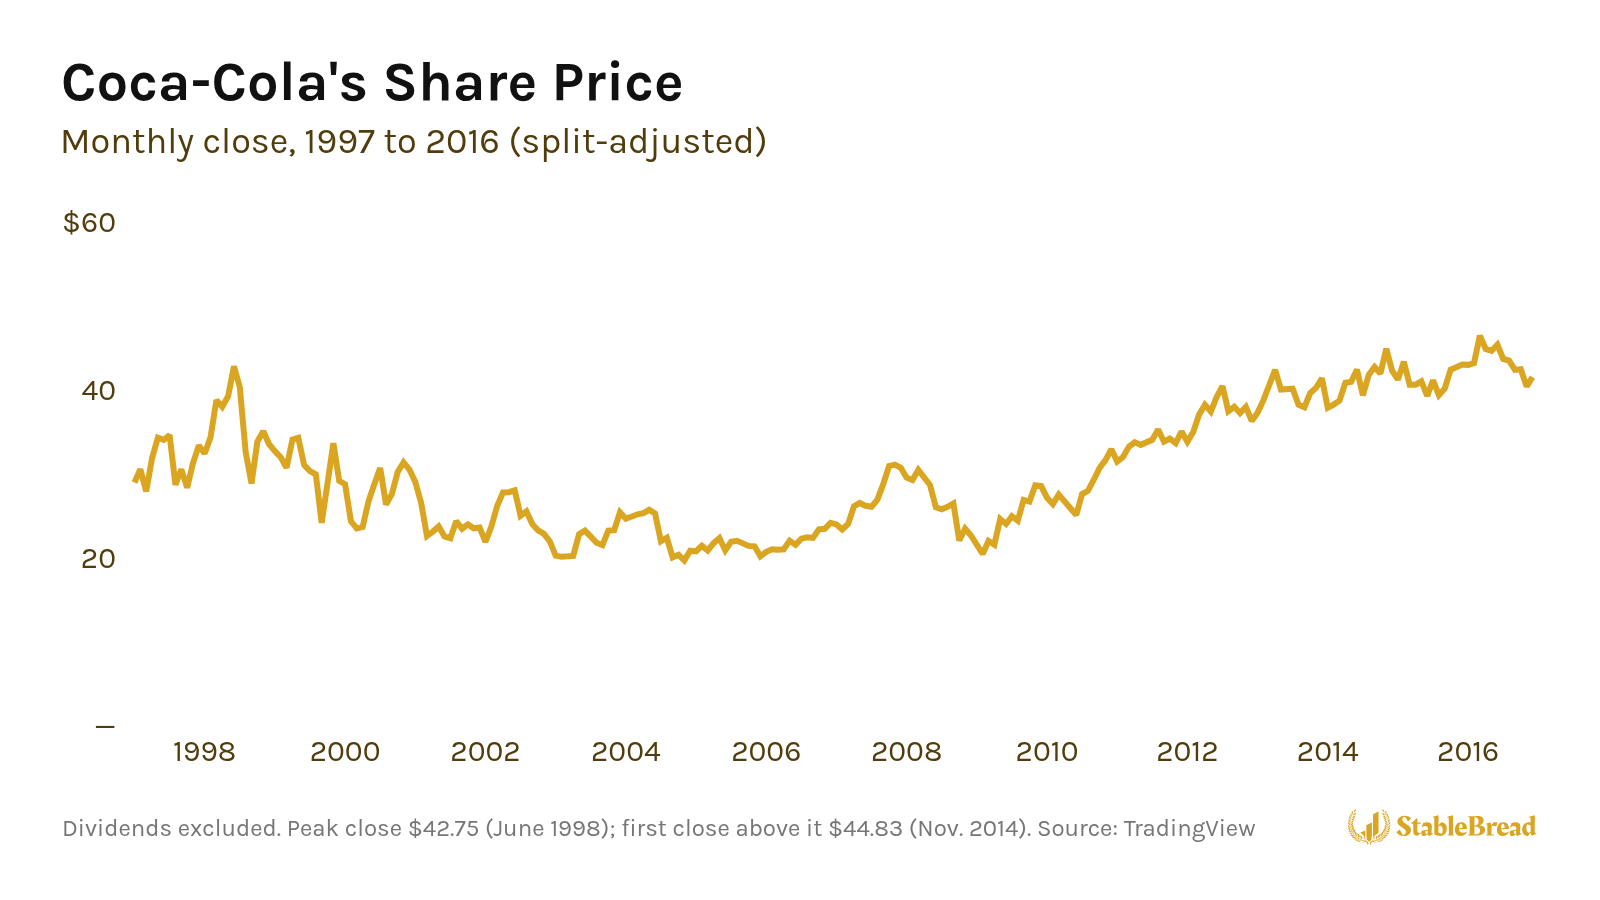
In his 1996 letter to shareholders, Buffett wrote that companies like Coca-Cola (KO) and Gillette “might well be labeled ‘The Inevitables,’” since he expected them to dominate their markets for decades. However, investors who bought them at their peak prices lost money for years.
Coca-Cola’s stock peaked in mid-1998, and its price didn’t get back to that level until late 2014:
Gillette’s shareholders fared even worse. Gillette’s stock fell 48% from its 1999 high by that November, and it was still below that high when Procter & Gamble agreed to buy the company in 2005.
Walmart is another example. At the end of 1999, its stock traded at more than 55x earnings, and its price didn’t get back to that level until mid-2012, even though Walmart’s net income nearly tripled from fiscal 2000 to fiscal 2012:
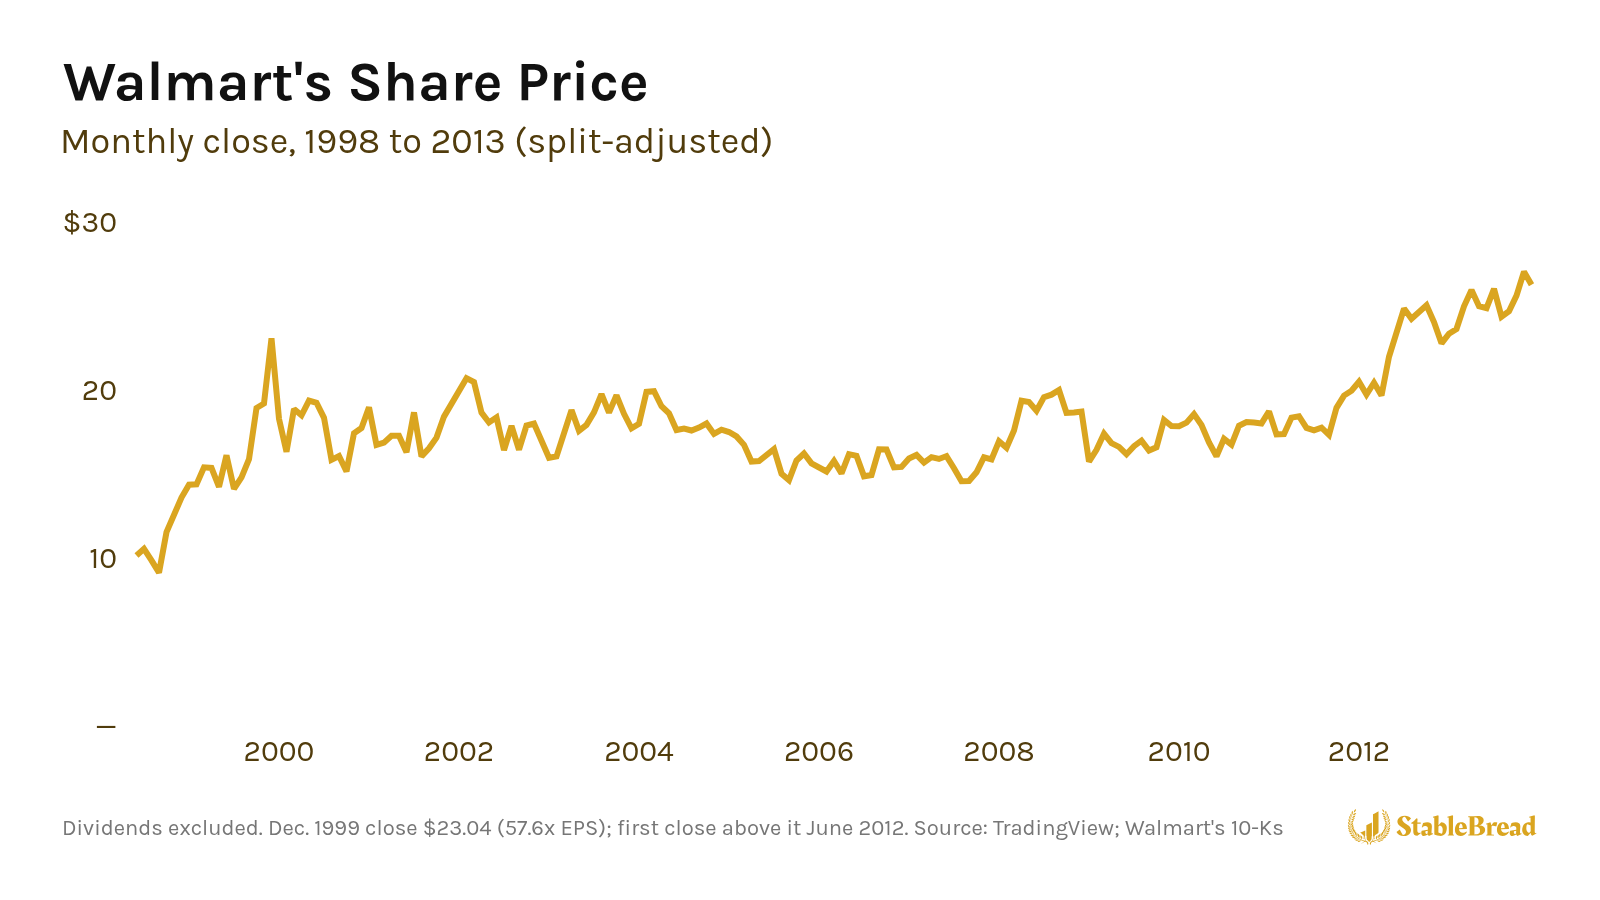
So even companies with the highest robustness ratios and widest moats can become poor investments at excessive prices. The robustness ratio helps you find businesses that create real value for their customers, but you still need to buy them at reasonable prices to avoid overpaying for that value creation.
