

Accruals are the gap between what a company reports as earnings and what it actually collects in cash. Under accrual accounting, companies record revenue when earned and expenses when incurred, regardless of when cash changes hands.
If a company reports $100M in net income but only $60M in operating cash flow, that $40M difference is accruals. Those accruals might represent legitimate timing differences that resolve themselves, like a customer who pays in the following quarter, or they might signal aggressive accounting that inflates current earnings at the expense of future periods.
This is why you’d prefer companies with low accruals, since high accruals raise questions about earnings quality. Accounting professor Richard Sloan formalized this intuition in his 1996 research with a simple ratio:
Sloan Ratio = (Net Income - Operating Cash Flow) / Average Total Assets
Sloan found that buying the lowest-accrual stocks and shorting the highest-accrual stocks earned 10.4%/year after adjusting for company size (based on U.S. stocks from 1962 to 1991).
Studies in 2005 and 2007 confirmed the pattern outside the U.S. LaFond (2005) found that low-accrual stocks beat high-accrual stocks in 15 of 17 developed countries, including Australia, Canada, and the U.K., and Pincus (2007) found the anomaly in 4 of the 20 countries it studied (Australia, Canada, the U.K., and the U.S.).
But what most investors don’t realize is that accruals on their own only tell part of the story.
In 2004, Hirshleifer, Hou, Teoh, and Zhang of Ohio State University turned a balance sheet measure called net operating assets (NOA) into an investing signal. Unlike a single year’s accruals, NOA captures a company’s cumulative history with accruals.
Philip Gray, Iris Siyu Liao, and Maria Strydom expanded on this in “The Profitability of Trading NOA and Accruals: One Effect or Two?” (2018). Examining 3,054 Australian companies from 1991 to 2016, they found that high accruals don’t always predict poor returns.
So if you check a company’s accruals before you buy its stock, NOA can help you tell when high accruals are actually a warning sign.
Below, I’ll explain how NOA measures a company’s cumulative track record with accruals, show how combining NOA with accruals produces a more effective screen, and discuss why that track record determines when high accruals actually matter.
Why NOA Matters
Net operating assets (NOA) capture the cumulative difference between accounting income and free cash flow across a company’s entire history. Rather than looking at a single year’s accruals, NOA reflects what has accumulated over time:
NOA = (Operating Assets - Operating Liabilities) / Prior Year’s Total Assets
where:
- Operating Assets = Total Assets - Cash & Equivalents - Short-Term Investments
- Operating Liabilities = Total Liabilities - Short-Term Debt - Long-Term Debt
Hirshleifer et al. (2004) described high NOA as “balance sheet bloat.” The authors showed that the higher a company’s NOA, the lower its stock returns tended to be for at least three years after its financial statements were released.
The logic follows directly from what accruals represent. Each year, accruals are recorded with the expectation that they’ll eventually convert to cash, and when they consistently don’t, NOA grows.
For example, a company might book revenue too aggressively, record some of its costs as assets instead of expenses, or fail to write down obsolete inventory. Each practice inflates NOA over time.
Get Our 50-Question Stock Analysis Checklist!
After researching hundreds of stocks, we built this 50-question checklist to guide your analysis and help you avoid costly mistakes.
Download ChecklistGray and his coauthors wanted to understand whether NOA and accruals capture the same information or provide distinct signals, and more importantly, how the two interact when used together.
NOA and Accrual Effects Exist Independently
Gray and his coauthors first verified that both anomalies exist in their Australian sample:

Sorting stocks into deciles by NOA produced a monthly spread of 1.33% between the lowest and highest groups (bottom 10% vs. top 10%) when stocks were value-weighted.
Compounded over 12 months, here’s what each NOA decile returned per year:
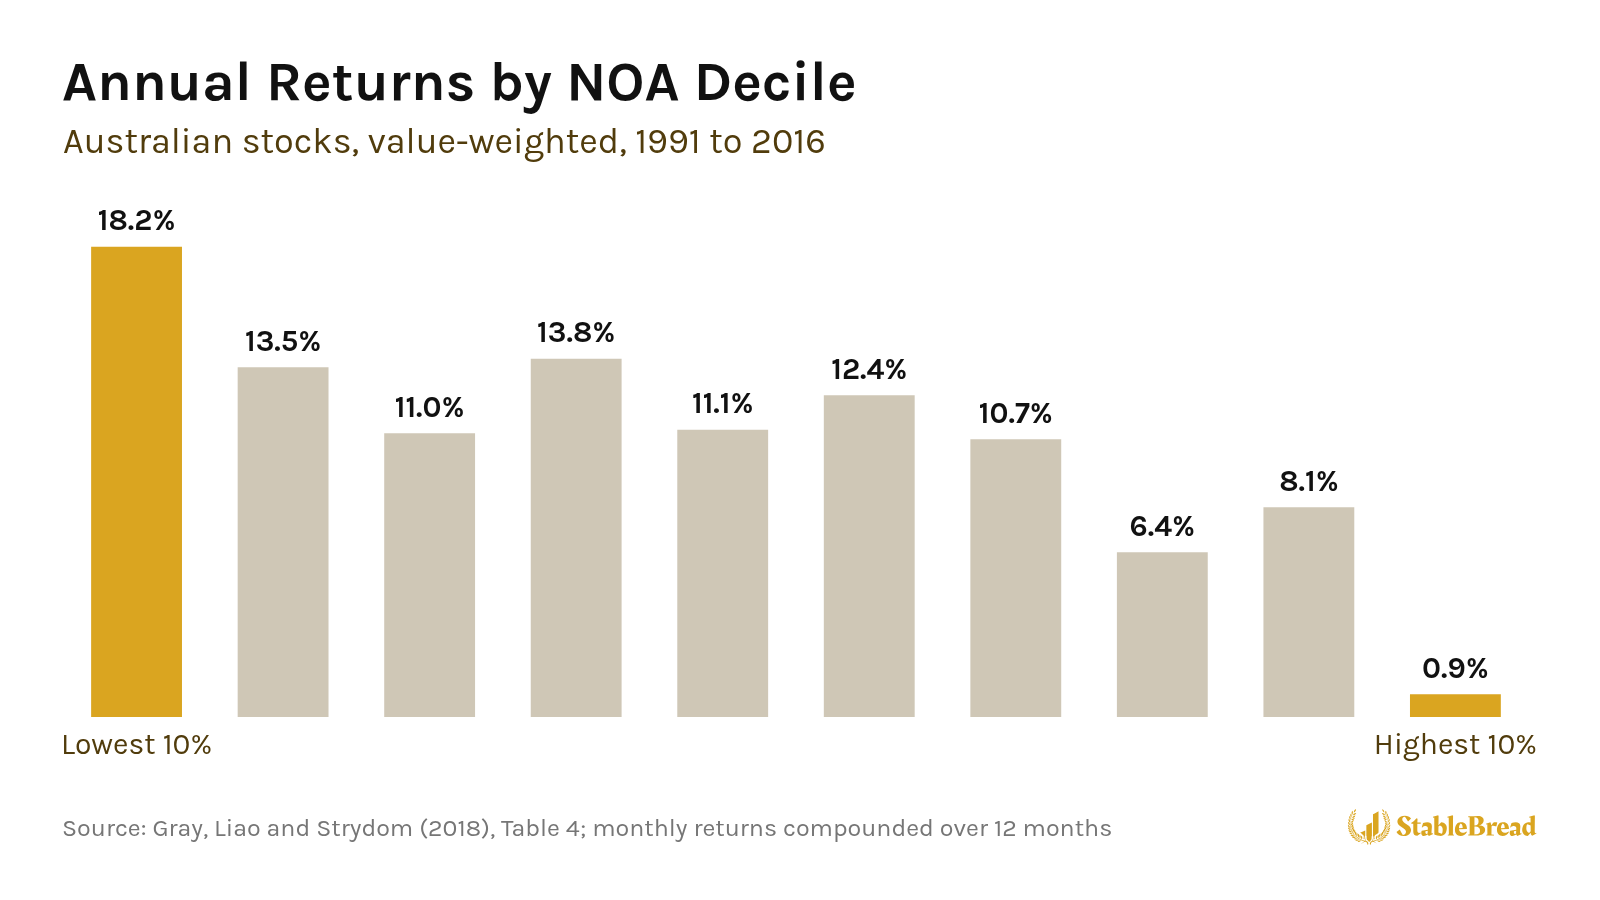
On an annualized basis, low-NOA stocks returned 18.2% while high-NOA stocks returned just 0.9%.
The gap of ~17%/year persisted after adjusting for the Fama-French three-factor model, which adjusts for how much a stock moves with the market, the company’s size, and its price compared with its book value. The alpha (the return left over after that adjustment) remained statistically significant at 0.93% monthly, so the gap is unlikely to be due to chance.
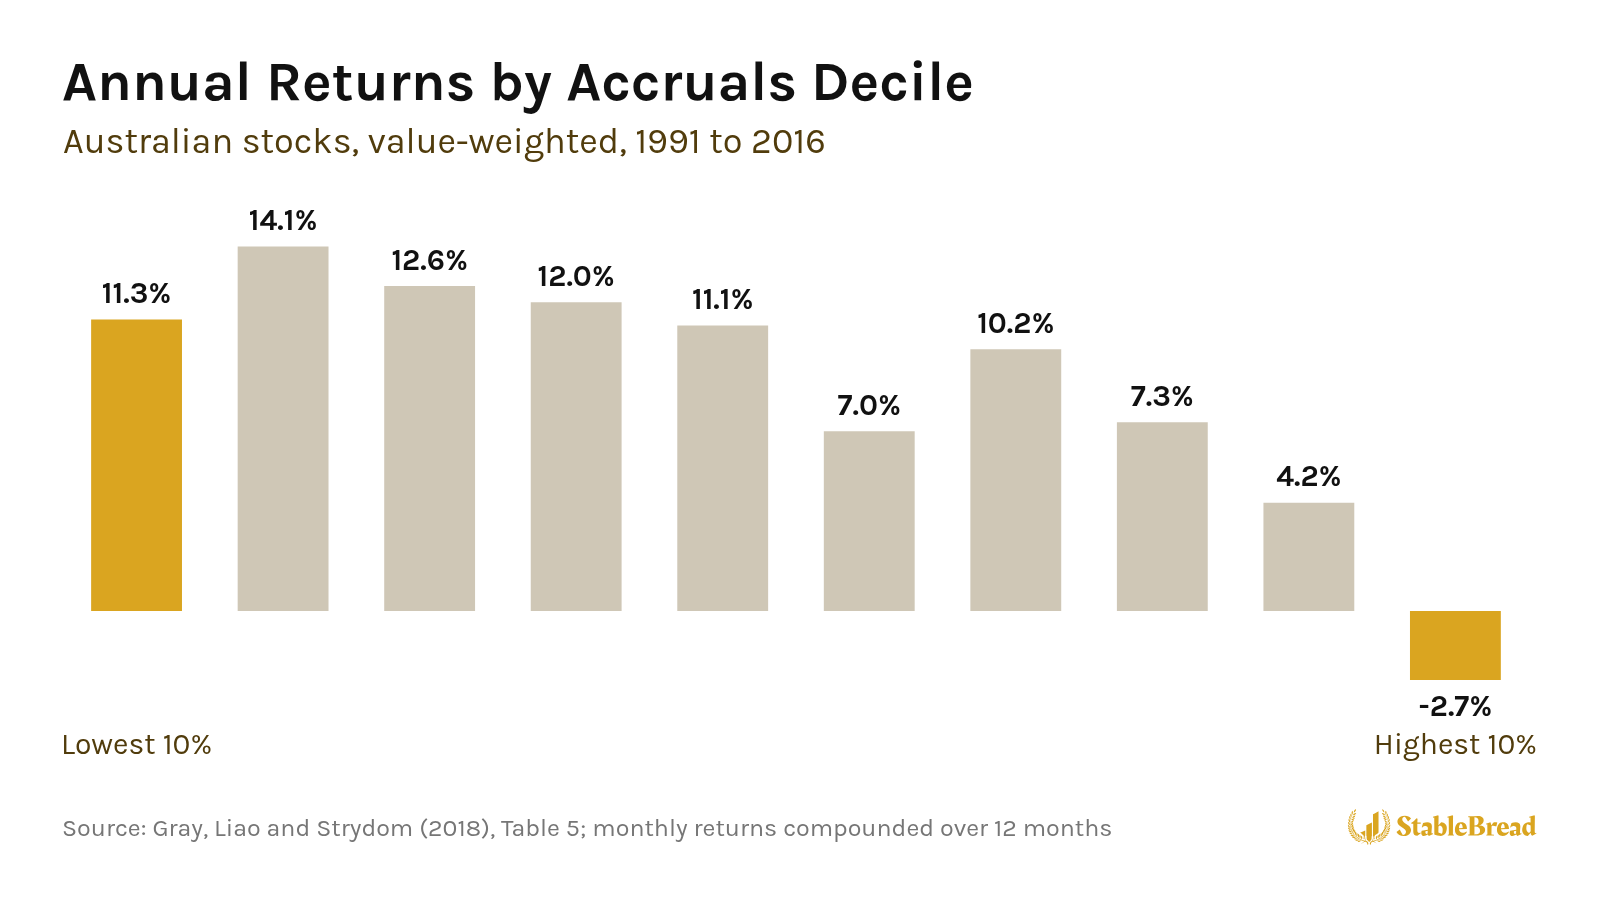
Sorting by accruals produced similar results:

The monthly spread between low-accrual and high-accrual deciles was 1.12% for value-weighted portfolios. Low-accrual stocks returned 0.90% monthly while high-accrual stocks returned -0.23%.
Annualized, low-accrual stocks returned 11.3% while high-accrual stocks lost 2.7%, a gap of ~14%:
When the researchers tested NOA and accruals together in a regression, neither one explained away the other. The coefficient on NOA was -0.107, and the coefficient on accruals was -0.114.
The key takeaway is that higher NOA and higher accruals each independently predict lower future returns.
NOA Determines When Accruals Matter
Gray and his coauthors’ central finding comes from how NOA and accruals interact. The researchers double-sorted stocks into 25 portfolios based on quintiles of both NOA and accruals. Sorting both ways let the researchers measure each effect while holding the other constant:

When controlling for accruals and allowing NOA to differ across groups, the NOA effect appeared in all five accrual quintiles. Low-NOA stocks outperformed high-NOA stocks regardless of their current accrual level. Every spread was statistically significant.
But when controlling for NOA and letting accruals vary, a different picture emerged. The accrual effect only showed up in the highest NOA quintile.
For stocks in that top group, low-accrual stocks outperformed high-accrual stocks by 1.18% monthly. For stocks in the other four NOA quintiles, the accrual spread was not statistically significant.
The authors summarize:
“This finding suggests that high levels of accruals per se are not bad news. An accrual effect only arises for firms that have a sustained track record of not converting accruals into cashflow.”
— Gray, Liao, and Strydom, The Profitability of Trading NOA and Accruals (2018)
In other words, high accruals only predicted weak returns at companies that had failed to turn their accruals into cash for years.
When a low-NOA company reports high accruals in a given year, its track record suggests those accruals will eventually convert to cash. In the study, stocks like that didn’t earn reliably less than low-NOA stocks with low accruals (1.29% vs. 1.79% monthly, a gap that wasn’t statistically significant).
When a high-NOA company reports high accruals, it reinforces an existing problem. The new accruals add to a balance sheet already showing poor conversion. These are the stocks that went on to underperform.
So a one-year spike in accruals means something different for a company with a clean track record than for a company that has consistently failed to convert accounting income into cash.
Combining Both Signals
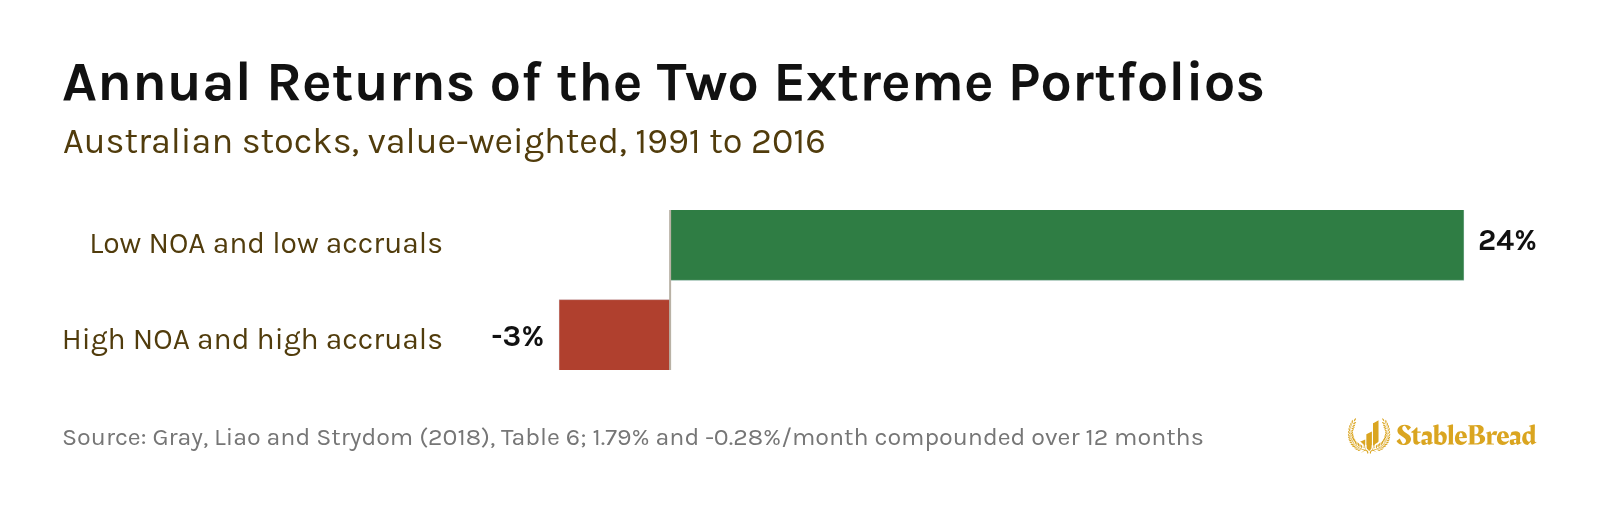
Gray and his coauthors found that buying stocks with low NOA and low accruals while shorting stocks with high NOA and high accruals produced monthly returns of 2.08%. This combined approach generated positive annual returns in 21 of the 24 years studied.
Stocks with both low NOA and low accruals returned 1.79% monthly, while those with both high NOA and high accruals returned -0.28%. Compounded over 12 months, that’s ~24%/year vs. ~-3%/year:
Overall, if you screen stocks using accruals, consider adding NOA as a filter. A company showing high accruals but maintaining low NOA isn’t necessarily a red flag. The track record with converting accruals to cash matters more than any single year’s figure.
Related: How to Use the Earnings Quality Model to Rank Stocks by Accounting Quality
